Well, I'm back on the Farallones for another seabird season, and so begins another series of stories from the field. I've decided this year to briefly describe all of the different projects we do out here during the summer. From simple tasks such as taking the weather, to complex tasks like keeping track of 400+ Cassin's auklet nest boxes. To kick off this series, I choose one of my favorite morning rituals, "sea watch". Every morning, the designated sea watch person (Katie in the case of the photo above) sets up a 50x spotting scope on the front porch of the PRBO House where we live, orients it southwest over the marine terrace, and watches the sea for a standard 5-minute period. The idea is to count any pelagic species other than the ones that breed on the island that pass through the fixed field of view, to get a sense of long-term changes in the timing and abundance of seabirds that use the waters around the Farallones.
Visualizing Effort on SEFI /
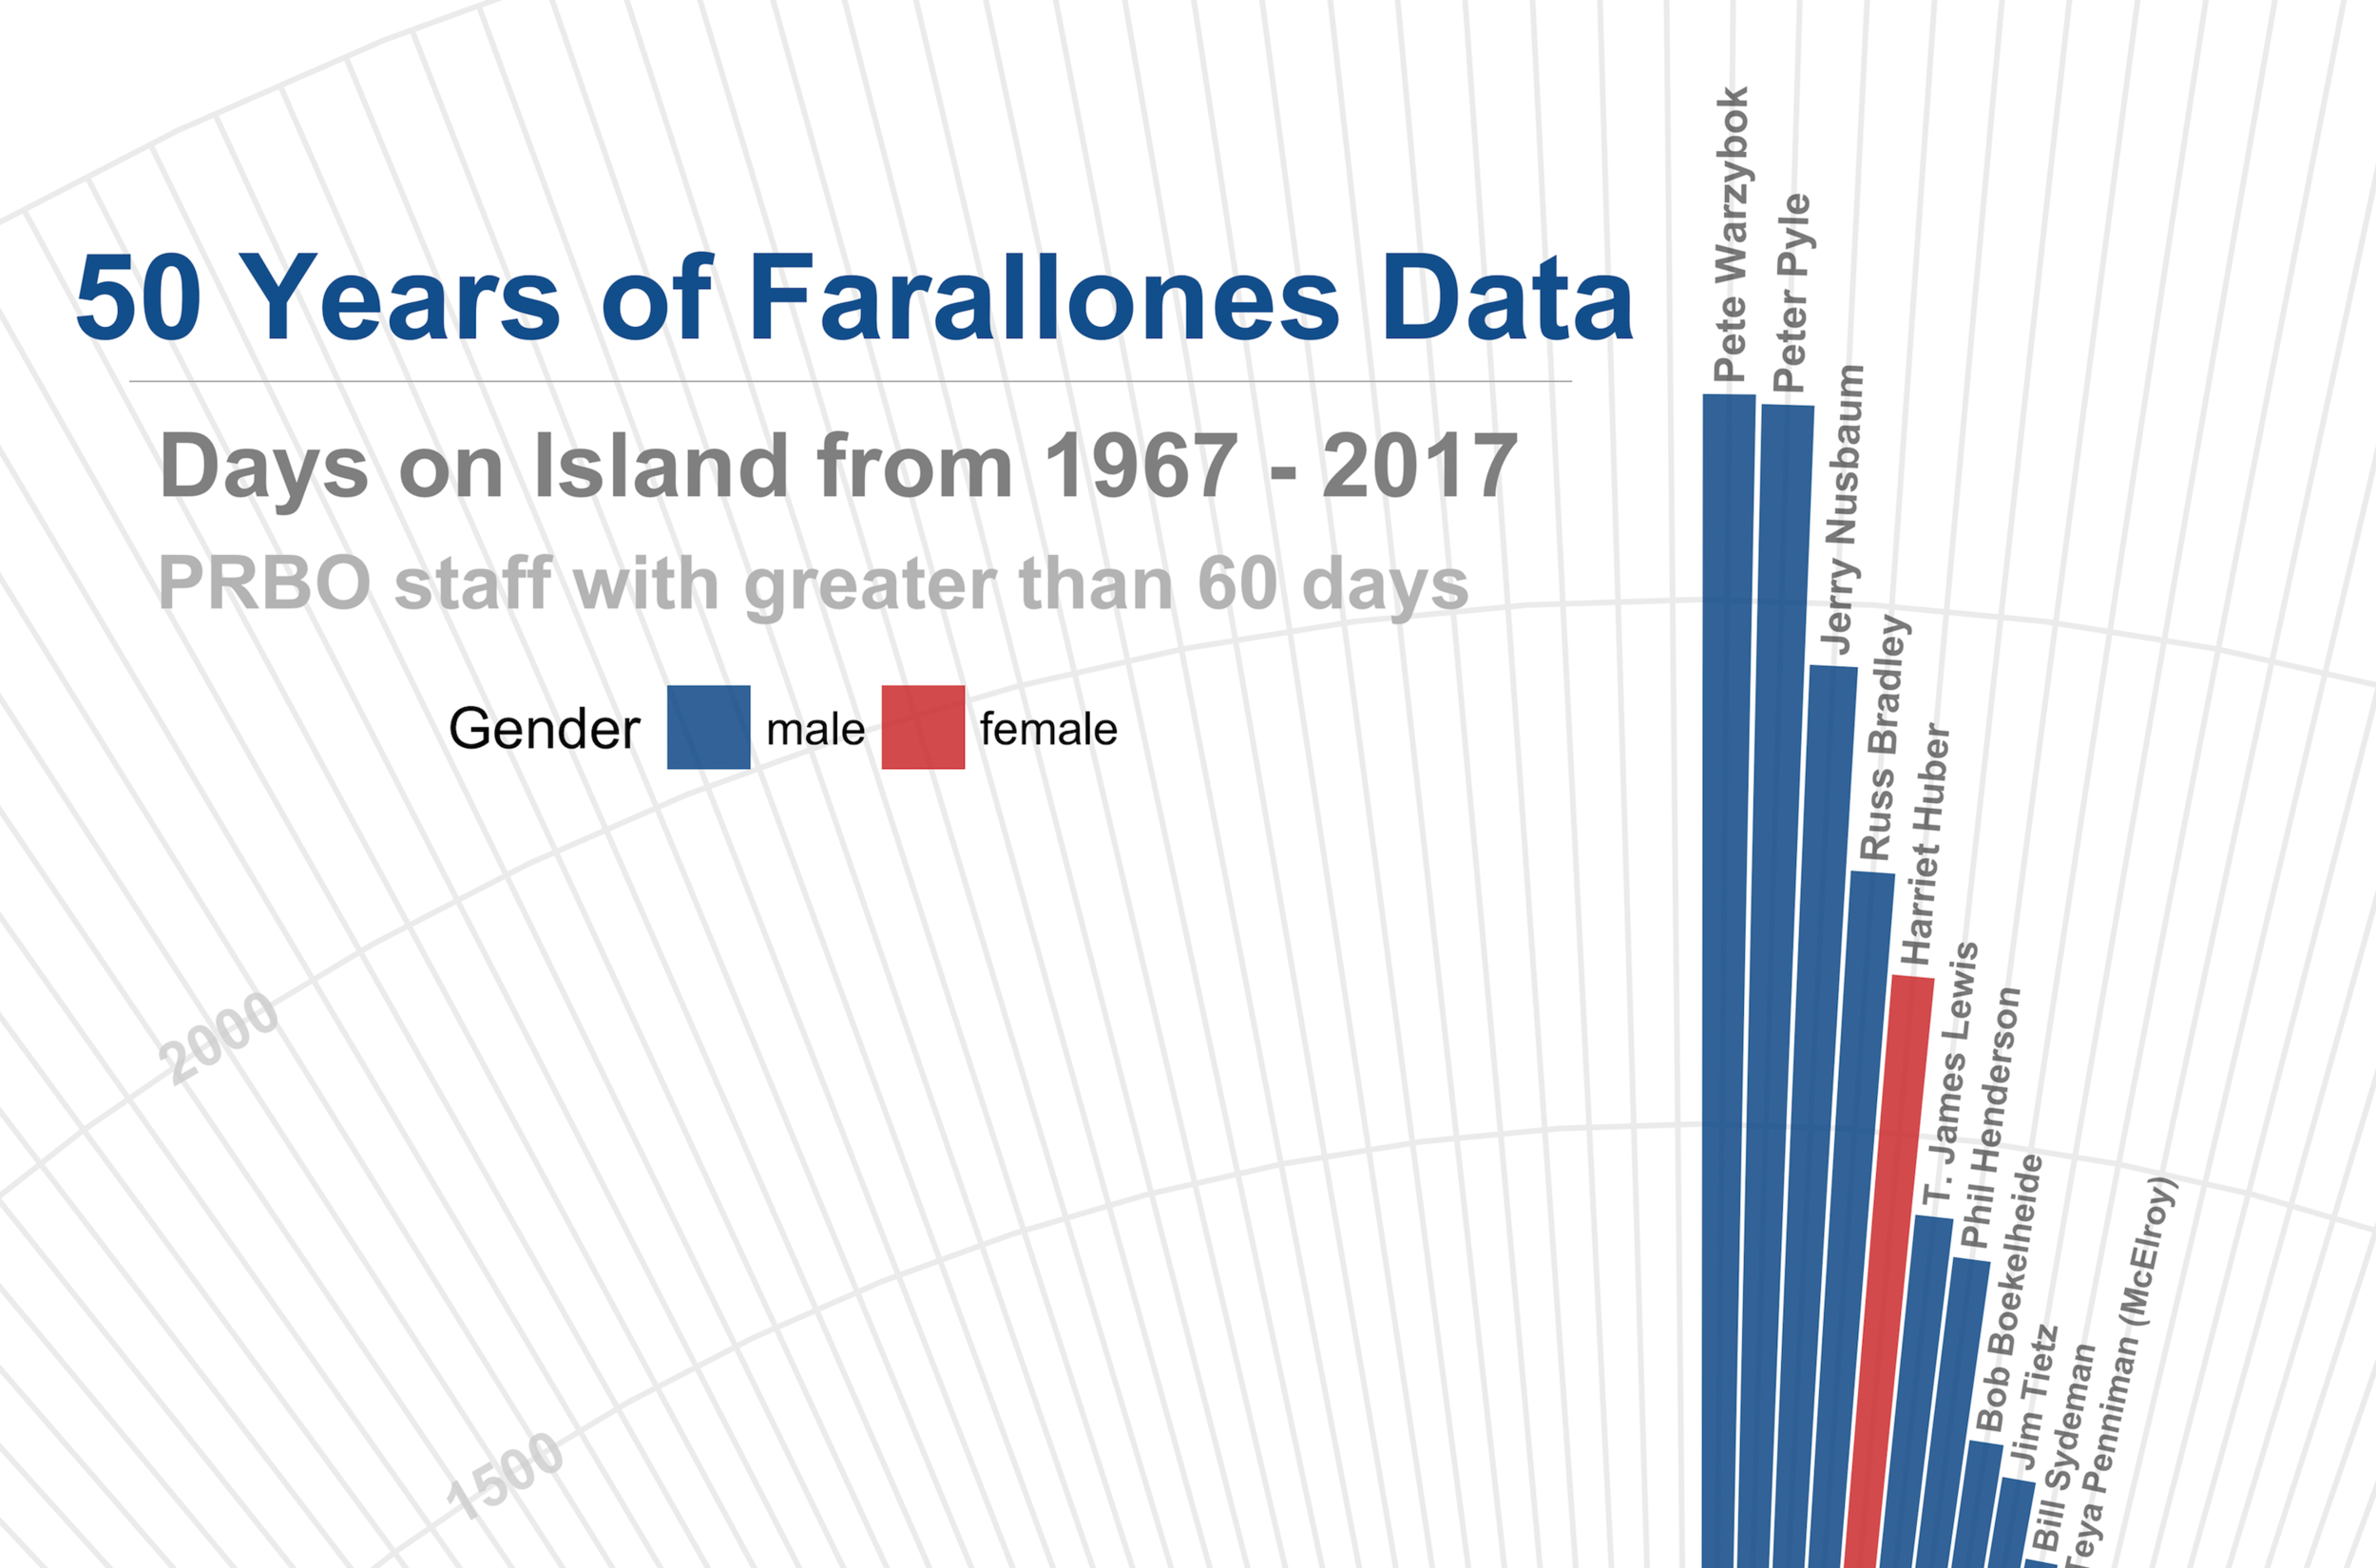
As the name would suggest, long-term datasets take a long time to develop. Not only does it take a continuous supply of resources to support the work, someone has to physically go out every year and collect the data. To visualize the time investment and sheer number of people required to collect 50 years of seabird and marine mammal data, I designed this circular bar plot, illustrating the extreme commitment by some and small contributions by many over the years. It depicts the total number of days spent on Southeast Farallon Island (SEFI) by current and former staff and interns of PRBO (now Point Blue Conservation Science). Each concentric circle radiating from the map of SEFI in the center represents an additional 500 days of service, with Pete Warzybok in the lead at over 2,000 days! To keep the plot from getting too cramped, I narrowed the number of names displayed to just partial or full PRBO associates with more than two months spent on island, so this plot excludes many more island residents affiliated with various agencies, contracts, and universities, as well as people with brief stints – sorry if that applies to you. The graphic was created entirely with the ggplot2 package in R, aside from the border and line below the title that were added later in Photoshop. A high resolution 16 x 20 .png file of the graphic can be downloaded here: DOWNLOAD FILE

La Paz /
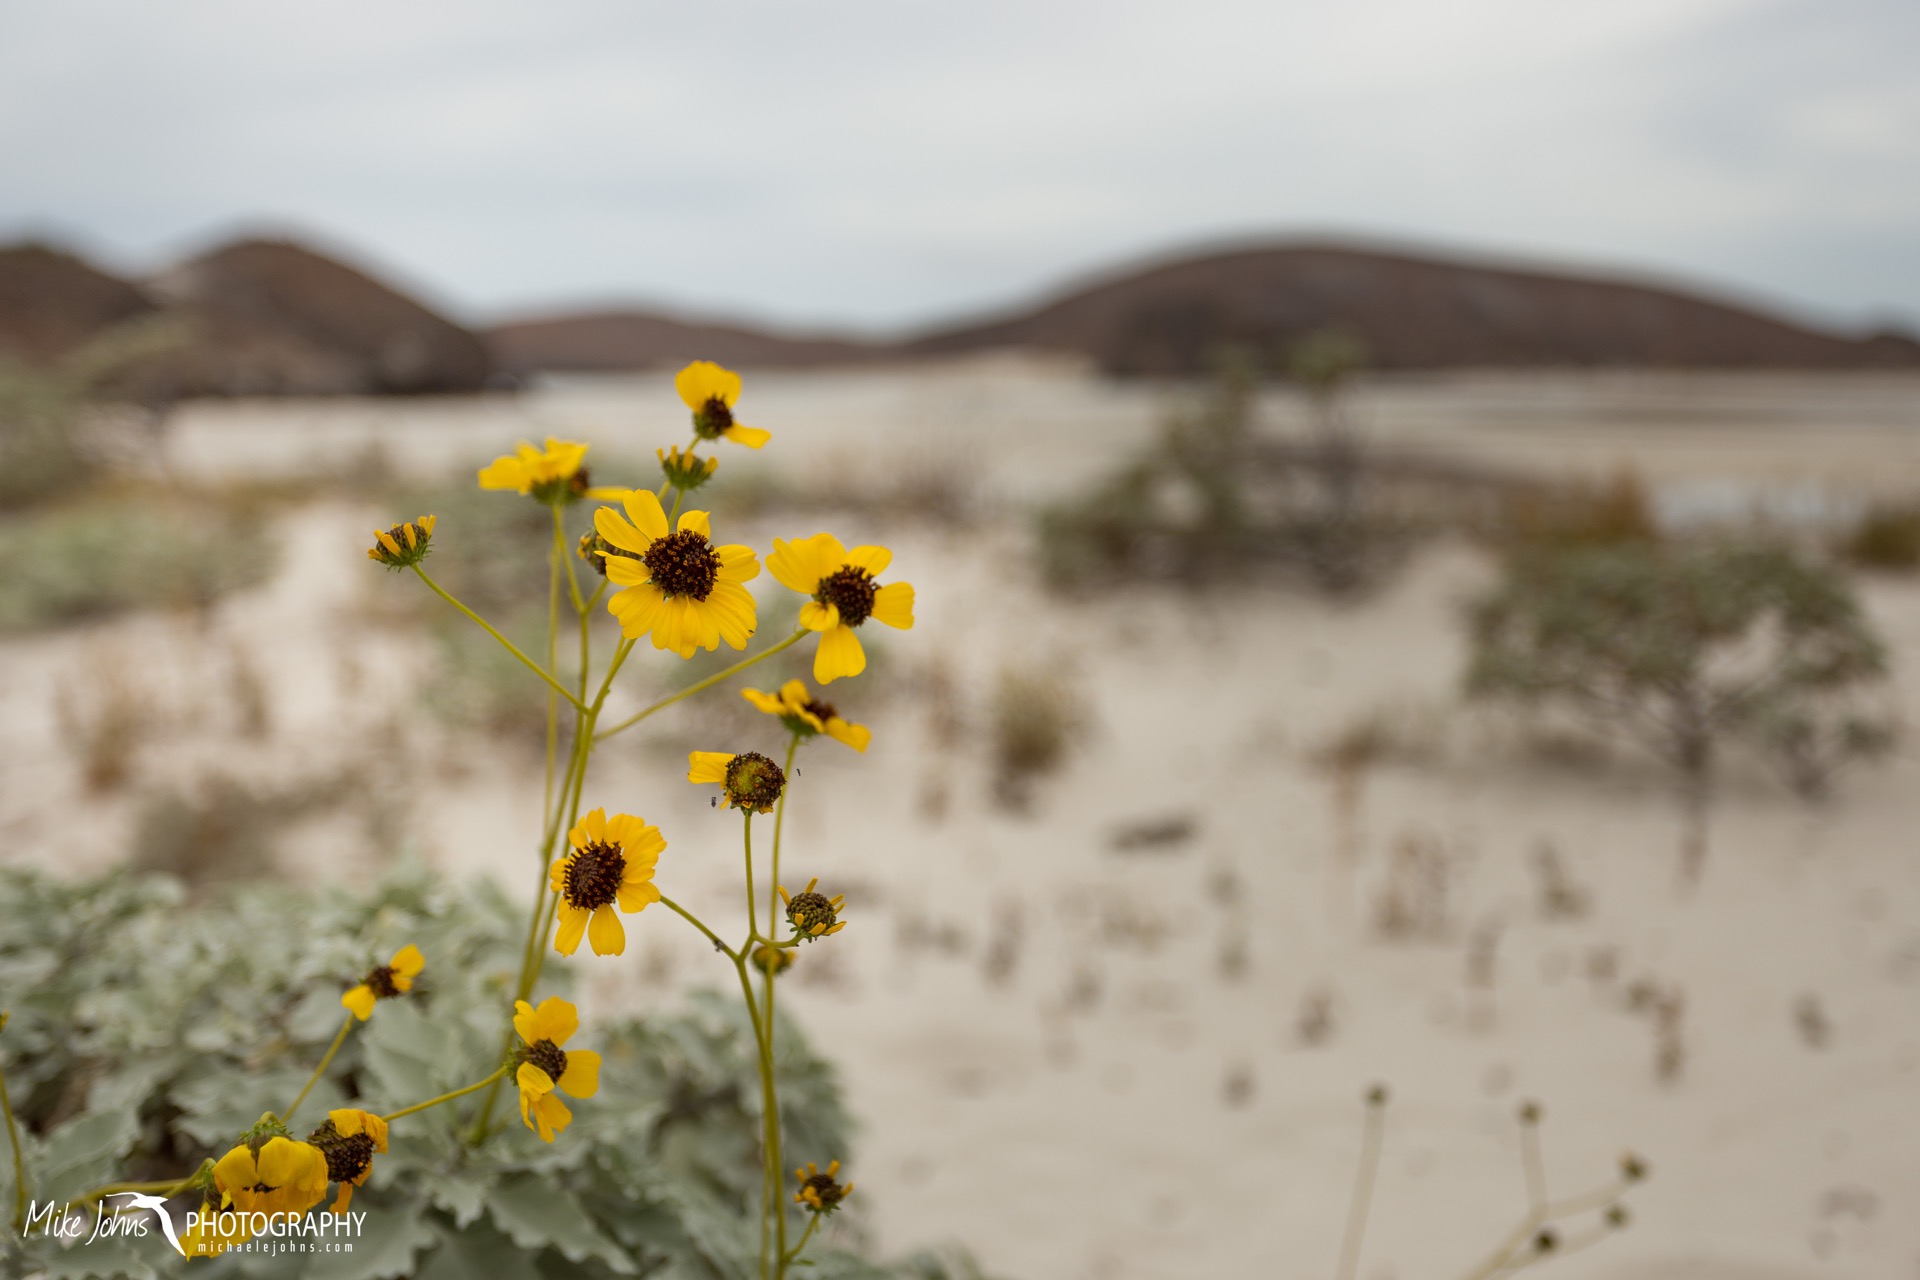
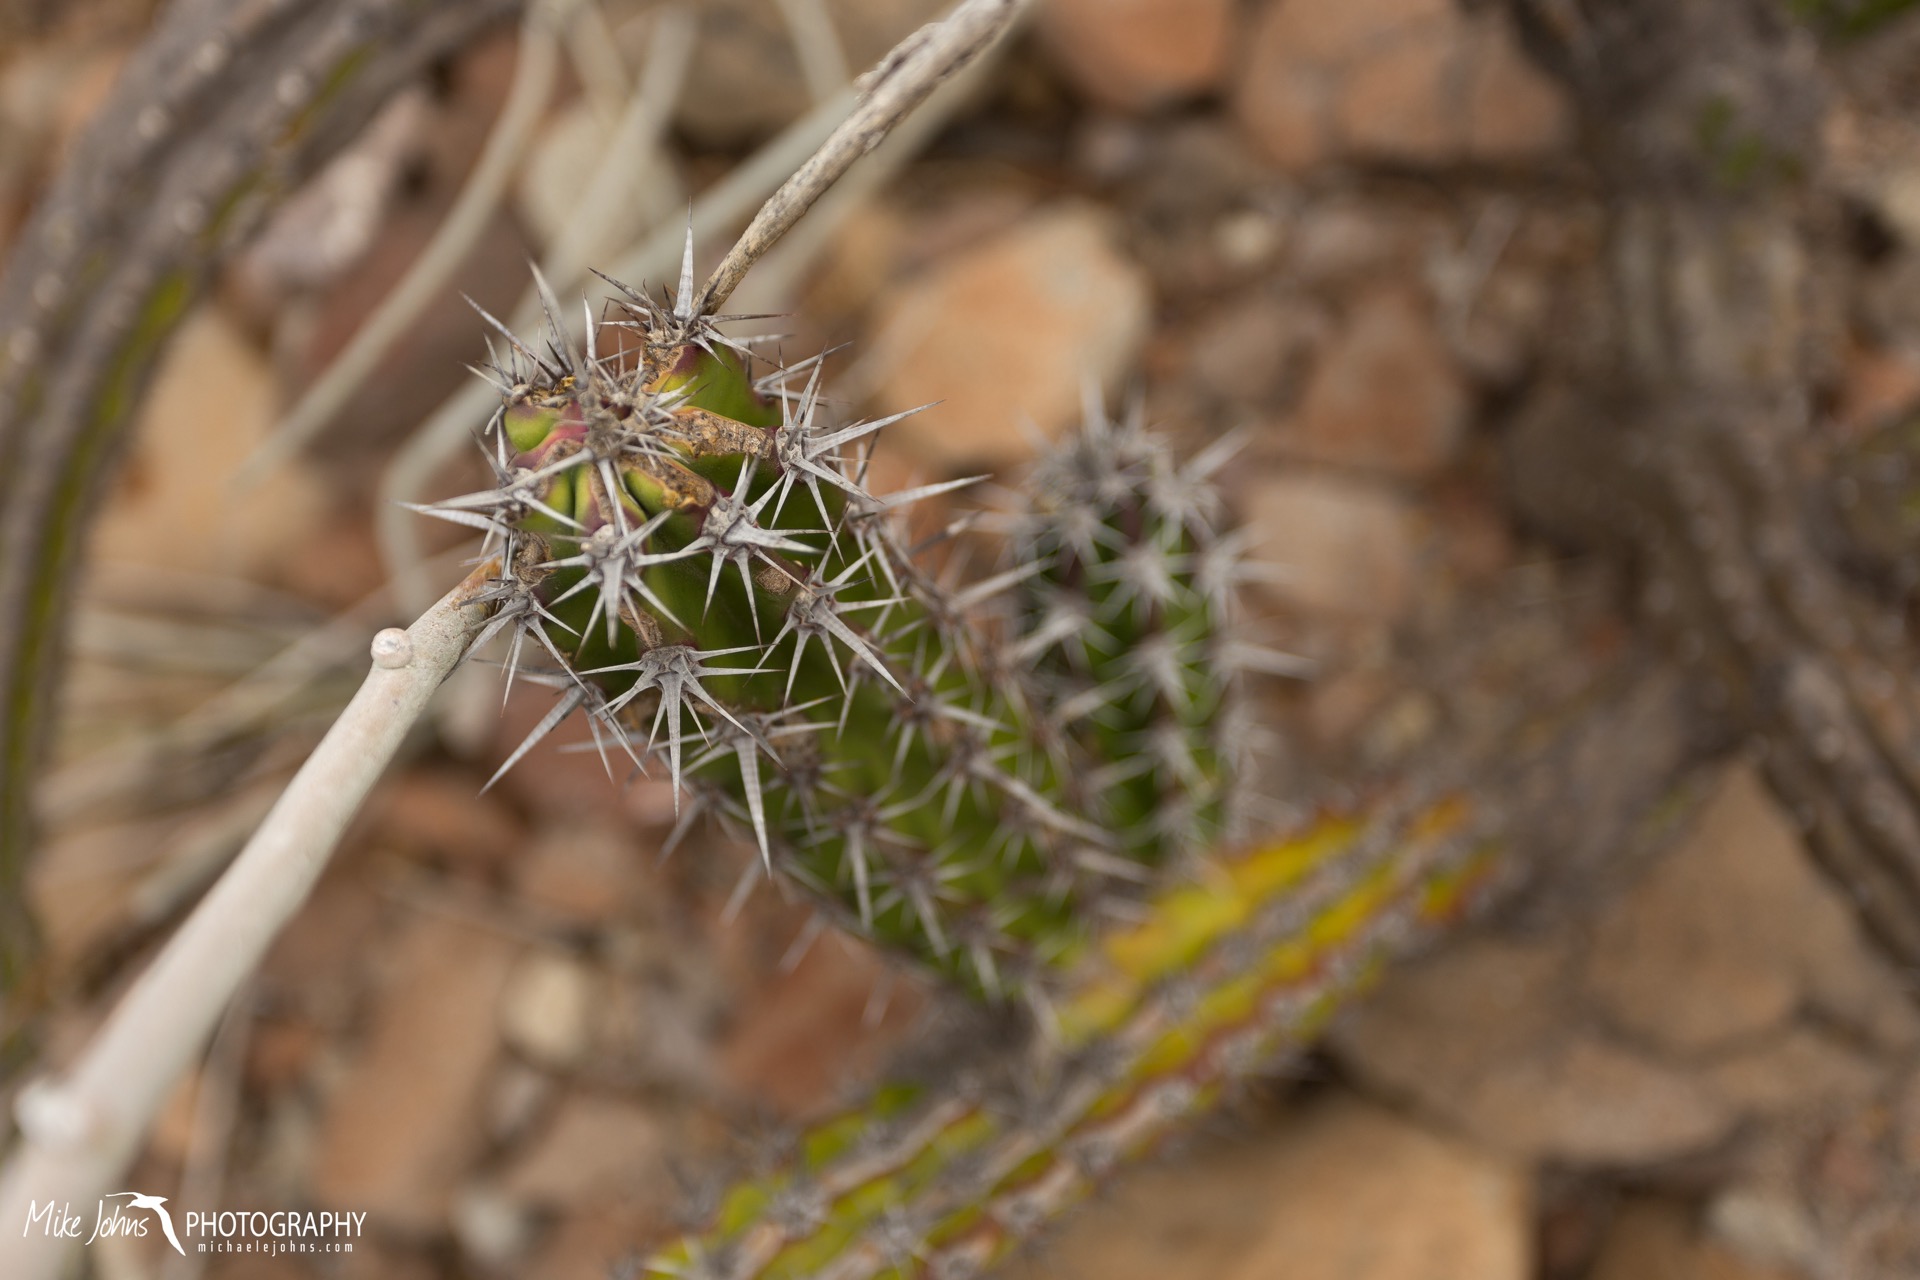
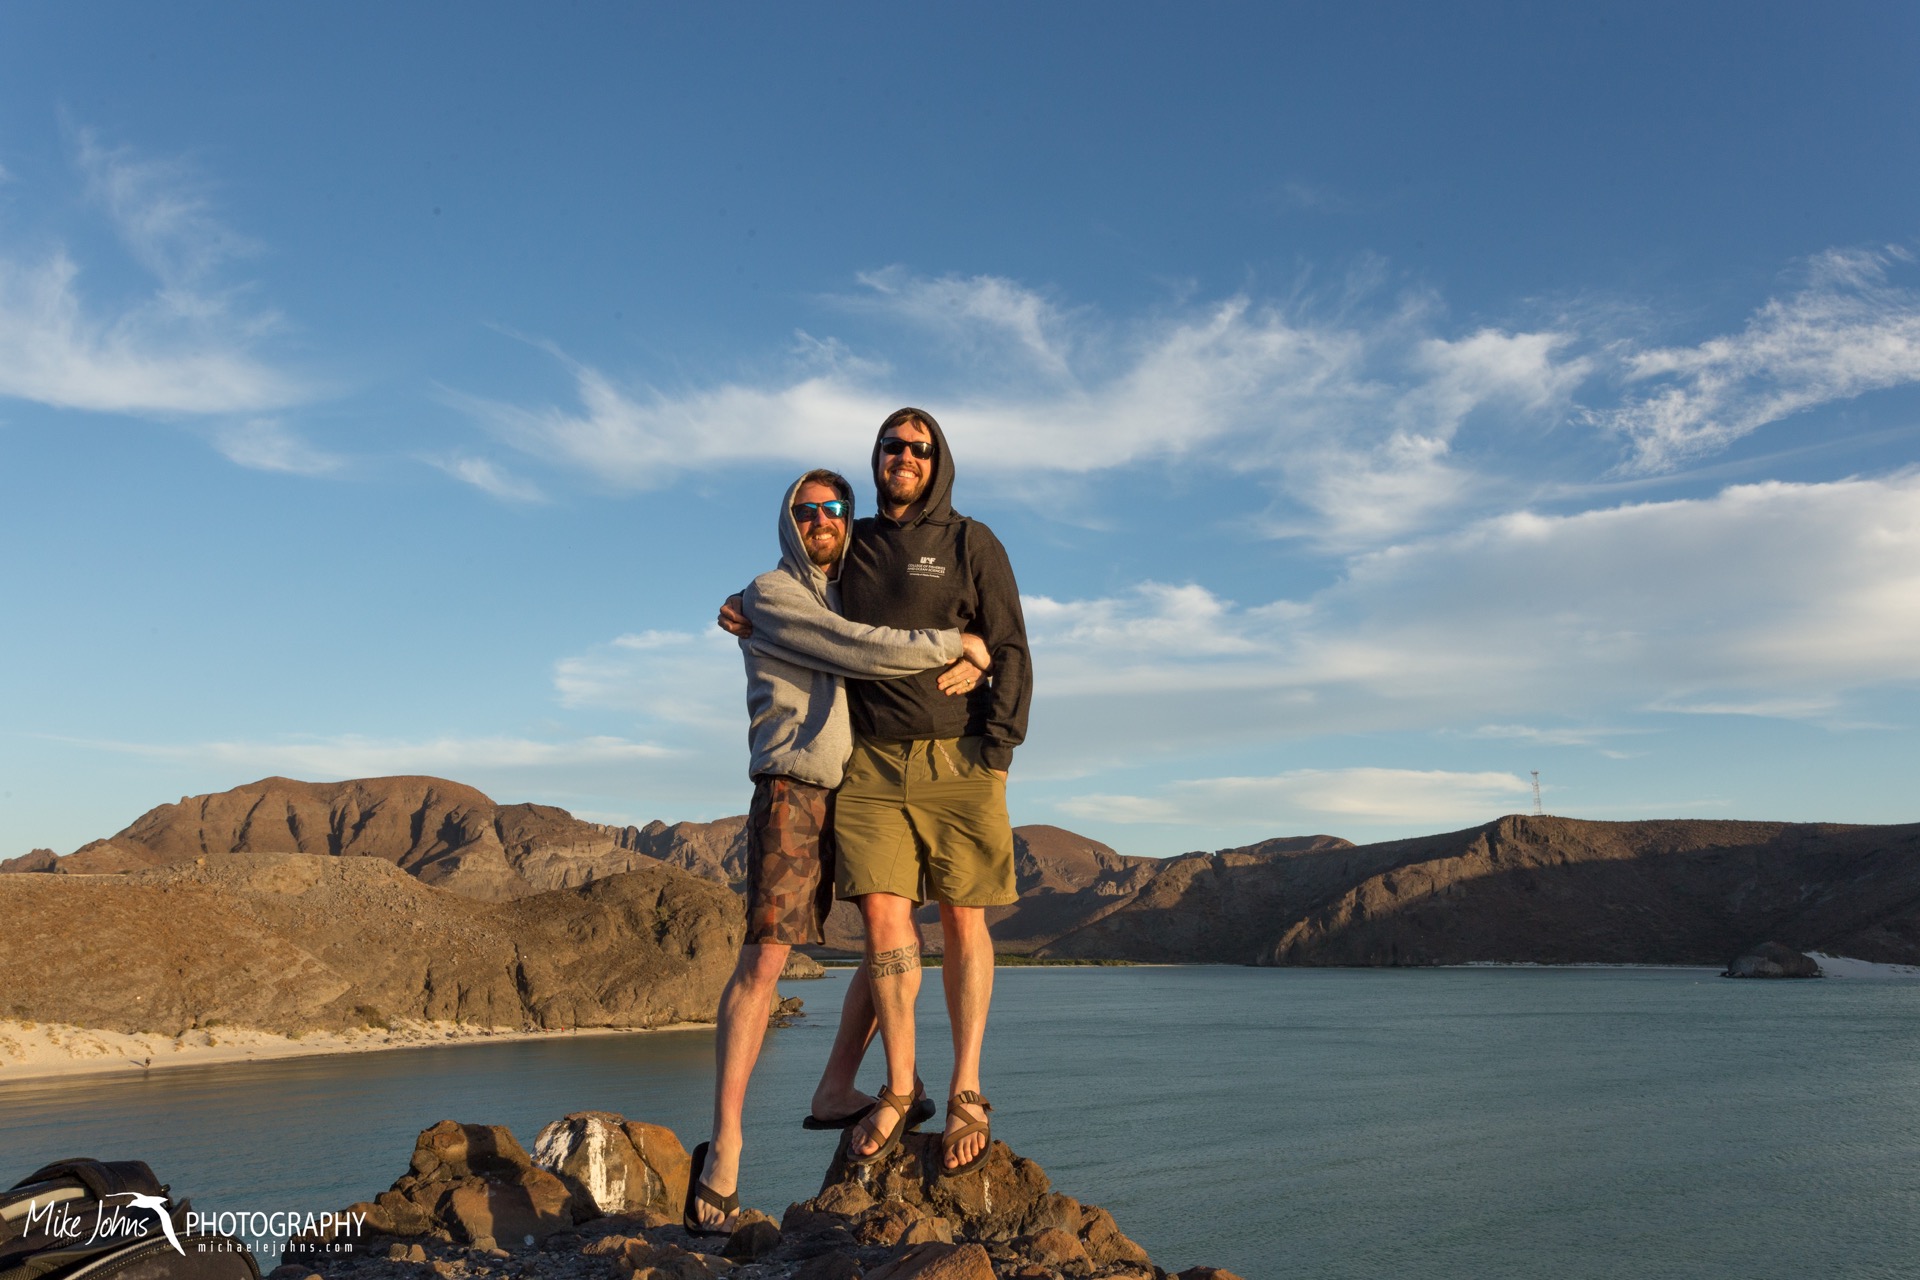
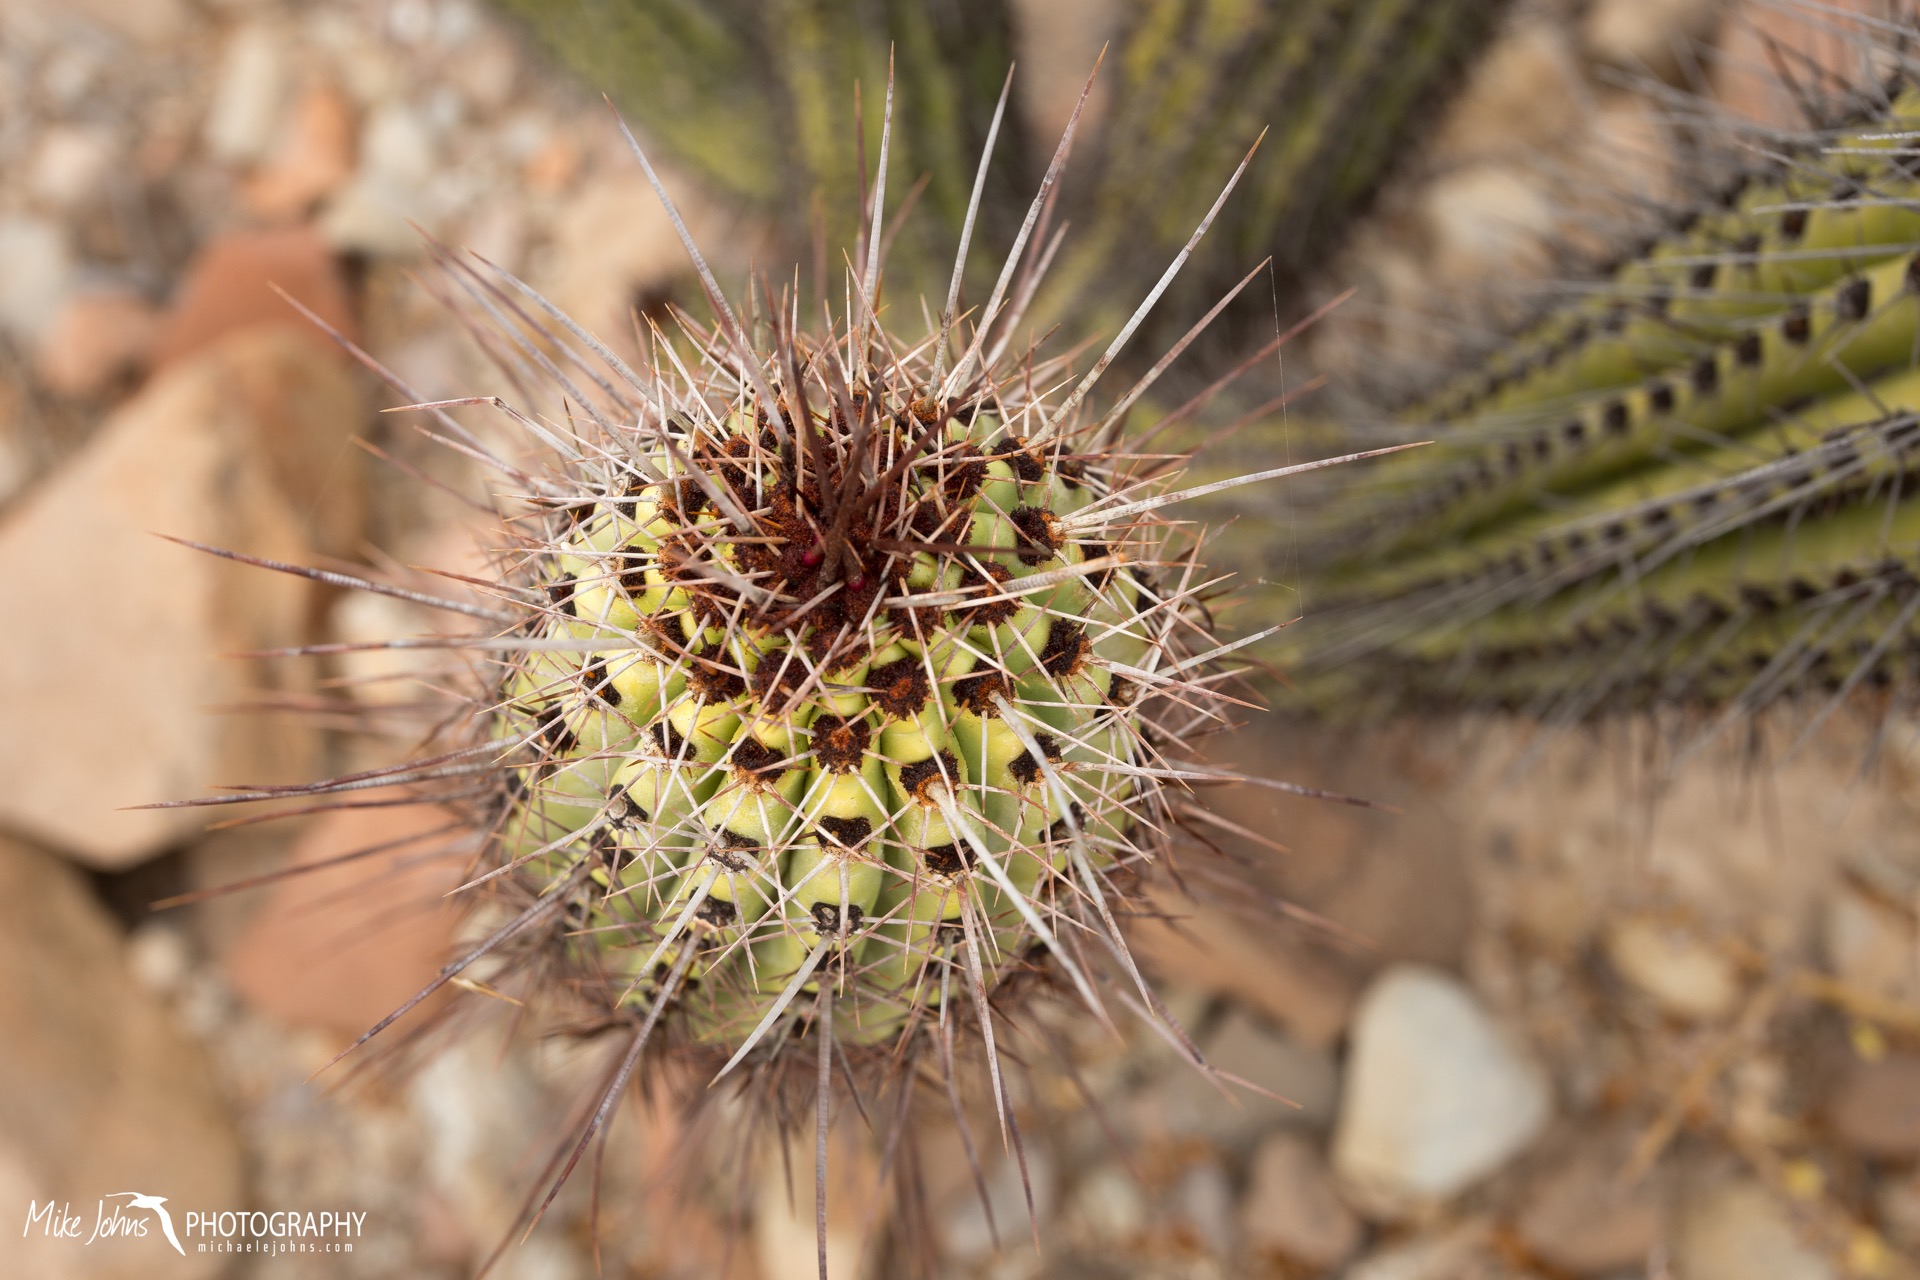
The Pacific Seabird Group puts on an annual conference to bring together scientists and students studying seabirds around the Pacific. Last year the conference was held in rainy Tacoma Washington. This year it was held in sunny La Paz, on the southern end of Baja California Mexico (see map below). I used the timing and location of this year's conference to give a talk on my double brooding work with Cassin's auklets, and take a much needed vacation from Fairbanks with Casey before I head out to the Farallones for another summer field season. Once the conference ended, we spent much of our time wading through the thigh-deep turquoise water of Balandra Beach, lounging in the sand, hiking among cacti, birding the Malecon, and drinking margaritas.


The highlight of our trip was the chance to swim with the world's largest fish, the whale shark. These massive filter feeders can reach lengths of up to 40 feet, and are found in warm tropical waters throughout the world. According to a paper by Ramírez-Macías and colleagues published in 2012, La Paz is one of several sites in the Sea of Cortez where predominately juvenile whale sharks congregate to feed in shallow plankton-rich waters. The site is a short panga ride from La Paz, on the north side of a long sand spit called El Mogote. We spent roughly 40 minutes watching a small (20 foot?) male slowly strain tiny plankton from the surface waters, which during this time of year felt less tropical and more temperate. The photo below was taken in Bahia de los Angeles, another important juvenile staging area further north, during my first encounter with whale sharks in 2006.


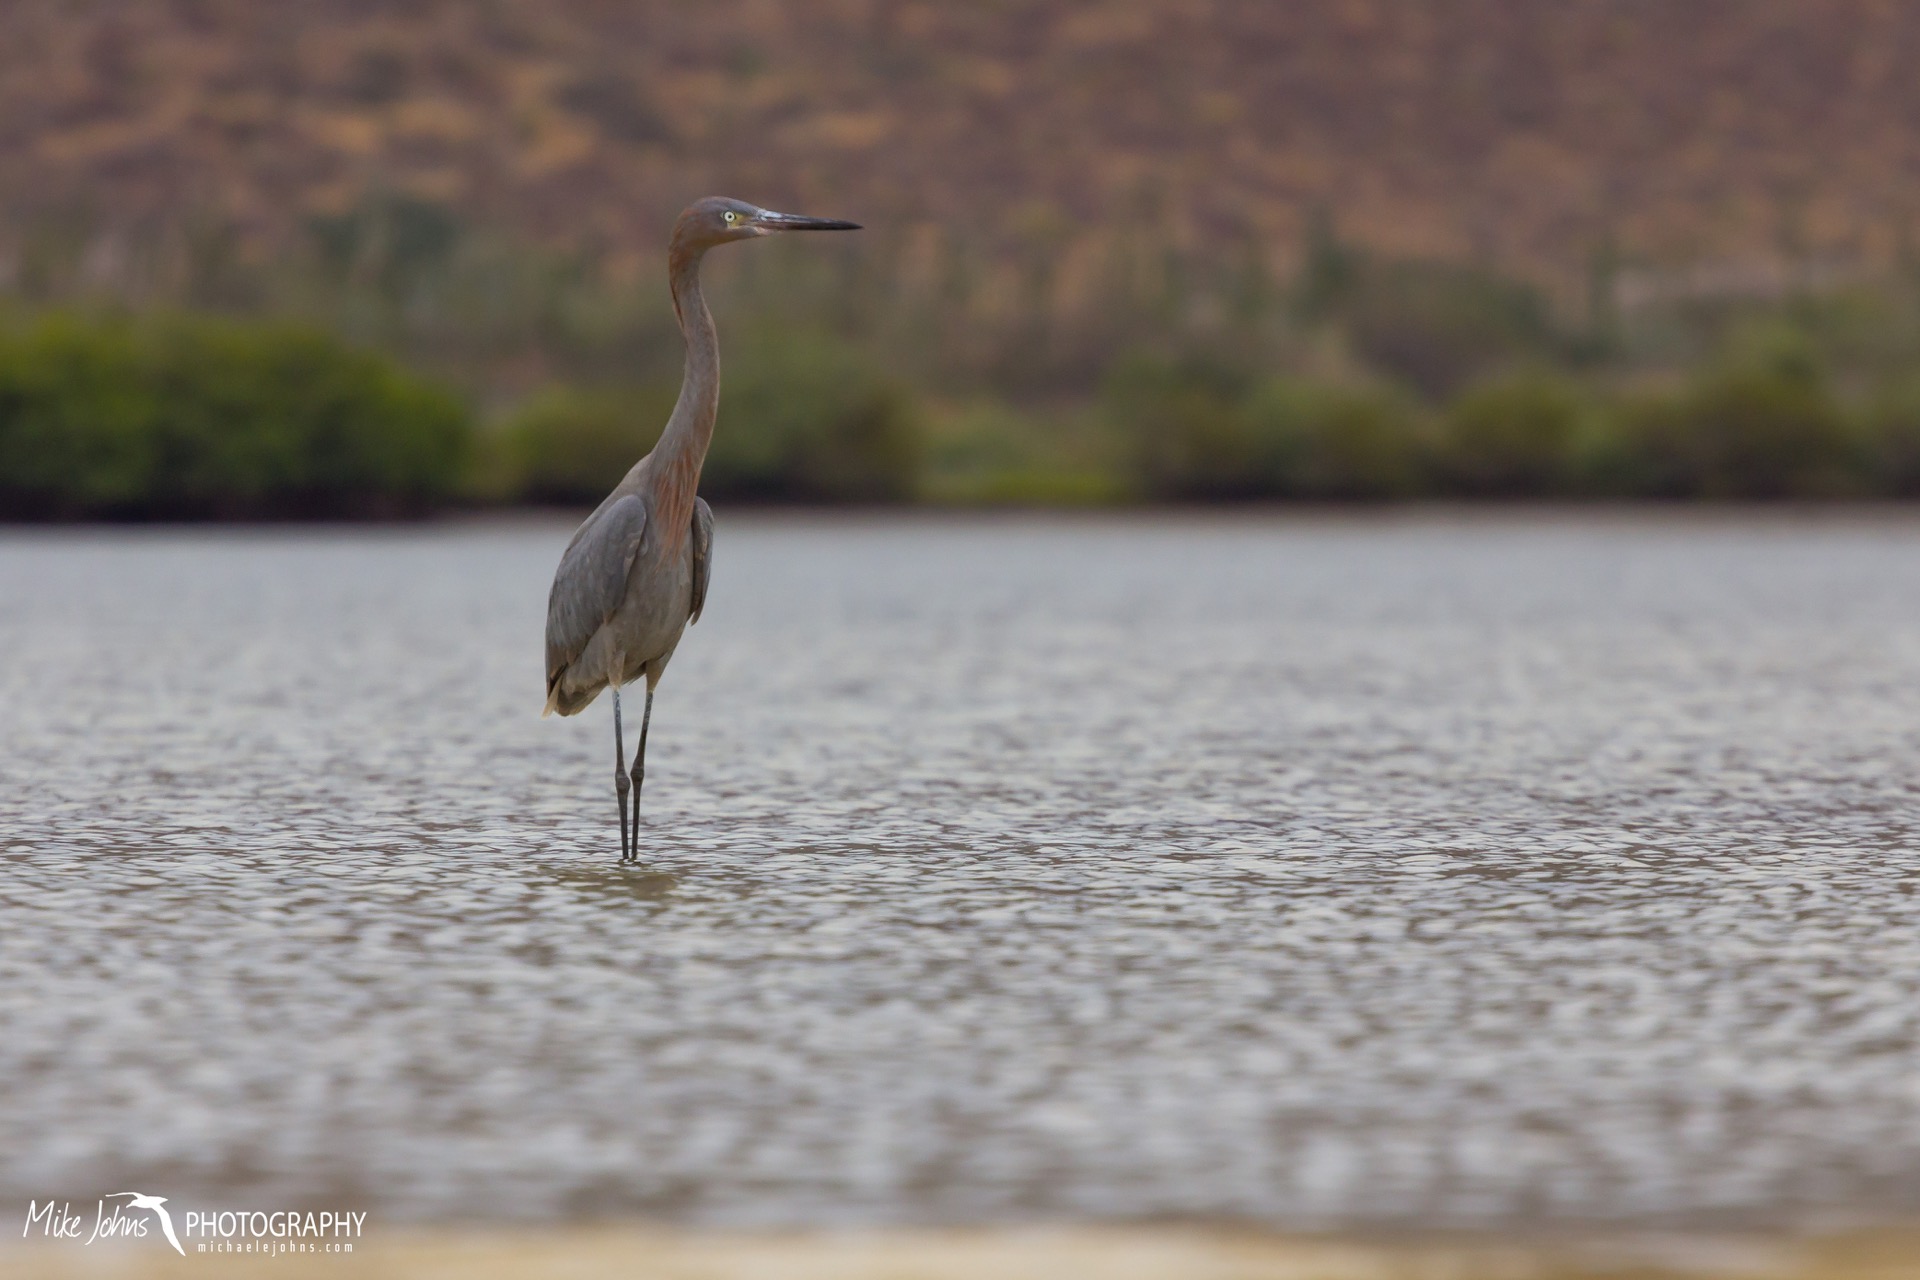


The images above, in order of appearance are: marbled godwits, magnificent frigatebird, tricolored heron, reddish egret, yellow-footed gull (eating a puffer fish), unknown mangrove crab, parade of brown nudibranchs found at low tide in the mangroves (presumably breeding).


Map of Baja California created with ggplot2 in R. Colored regions indicate topography of land, grays indicate bathymetry of the sea, for those not familiar with the region. La Paz is tucked away on a shallow bay at the southern tip on the Sea of Cortez side. The color pallette for this plot was inspired by the local geology.