Denali Road Lottery by Michael Johns

More than a century ago, the United States congress was persuaded to create Denali National Park, a now 6 million acre wildlife preserve named after the tallest mountain in North America. By design, the human footprint within the park remains minimal, with few facilities, no real hiking trails, and a single 92 mile-long dirt road. Private vehicles are restricted beyond the Savage River Campground, at mile 15 on the park road. From there, a fleet of buses services the remainder of the road, allowing visitors to hop on and off wherever they like. This enables the public to access the spectacular wildlife and scenery the park has to offer, without the headache and chaos of thousands of vehicles clogging up the road every time a brown bear crosses.

At the end of the summer tourist season in mid September, the buses are parked for the winter and the full length of the Denali park road opens to select group of lottery winners. Every year people can enter what is called the Denali Road Lottery, where up to 1600 private vehicles (400 per day over a 4-day period) are selected at random and allowed to drive the 92 mile stretch of wilderness road all the way to its terminus at Wonder Lake. Winners of this lottery have the freedom to drive at their leisure, stopping whenever and wherever scenic vistas and wild animals are encountered.

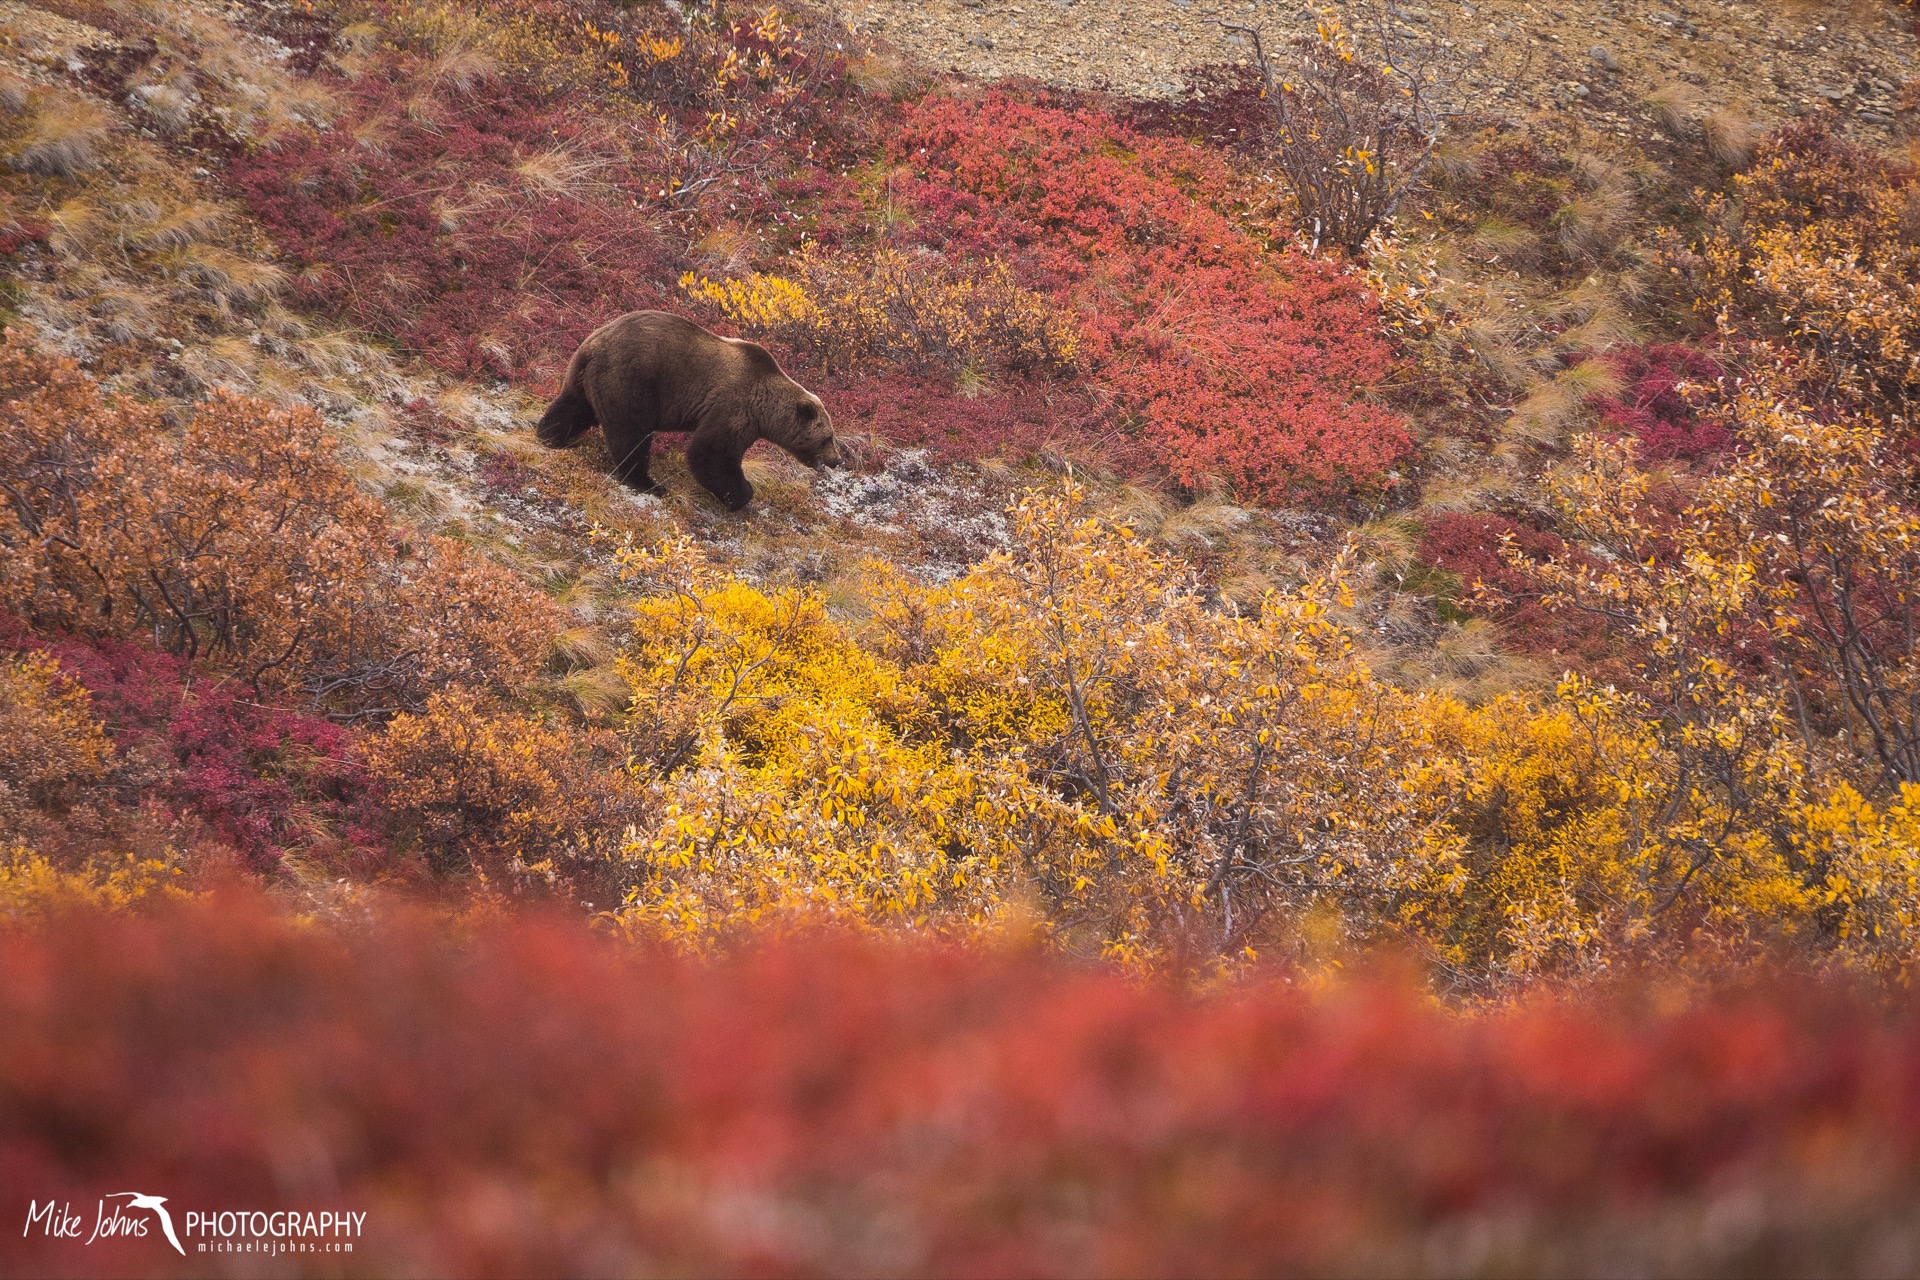
According to the National Parks Service website, roughly 11,400 applications were received in 2017, equating to a 1 and 7 odds of getting drawn. Casey was lucky enough to be drawn, which aligned perfectly with a visit from our good friend Amy. So on the final day of the road lottery, we got to experience the fall colors, sweeping views, and iconic Alaskan wildlife of Denali. Except the actual mountain itself, which was cloaked in low clouds and fog…

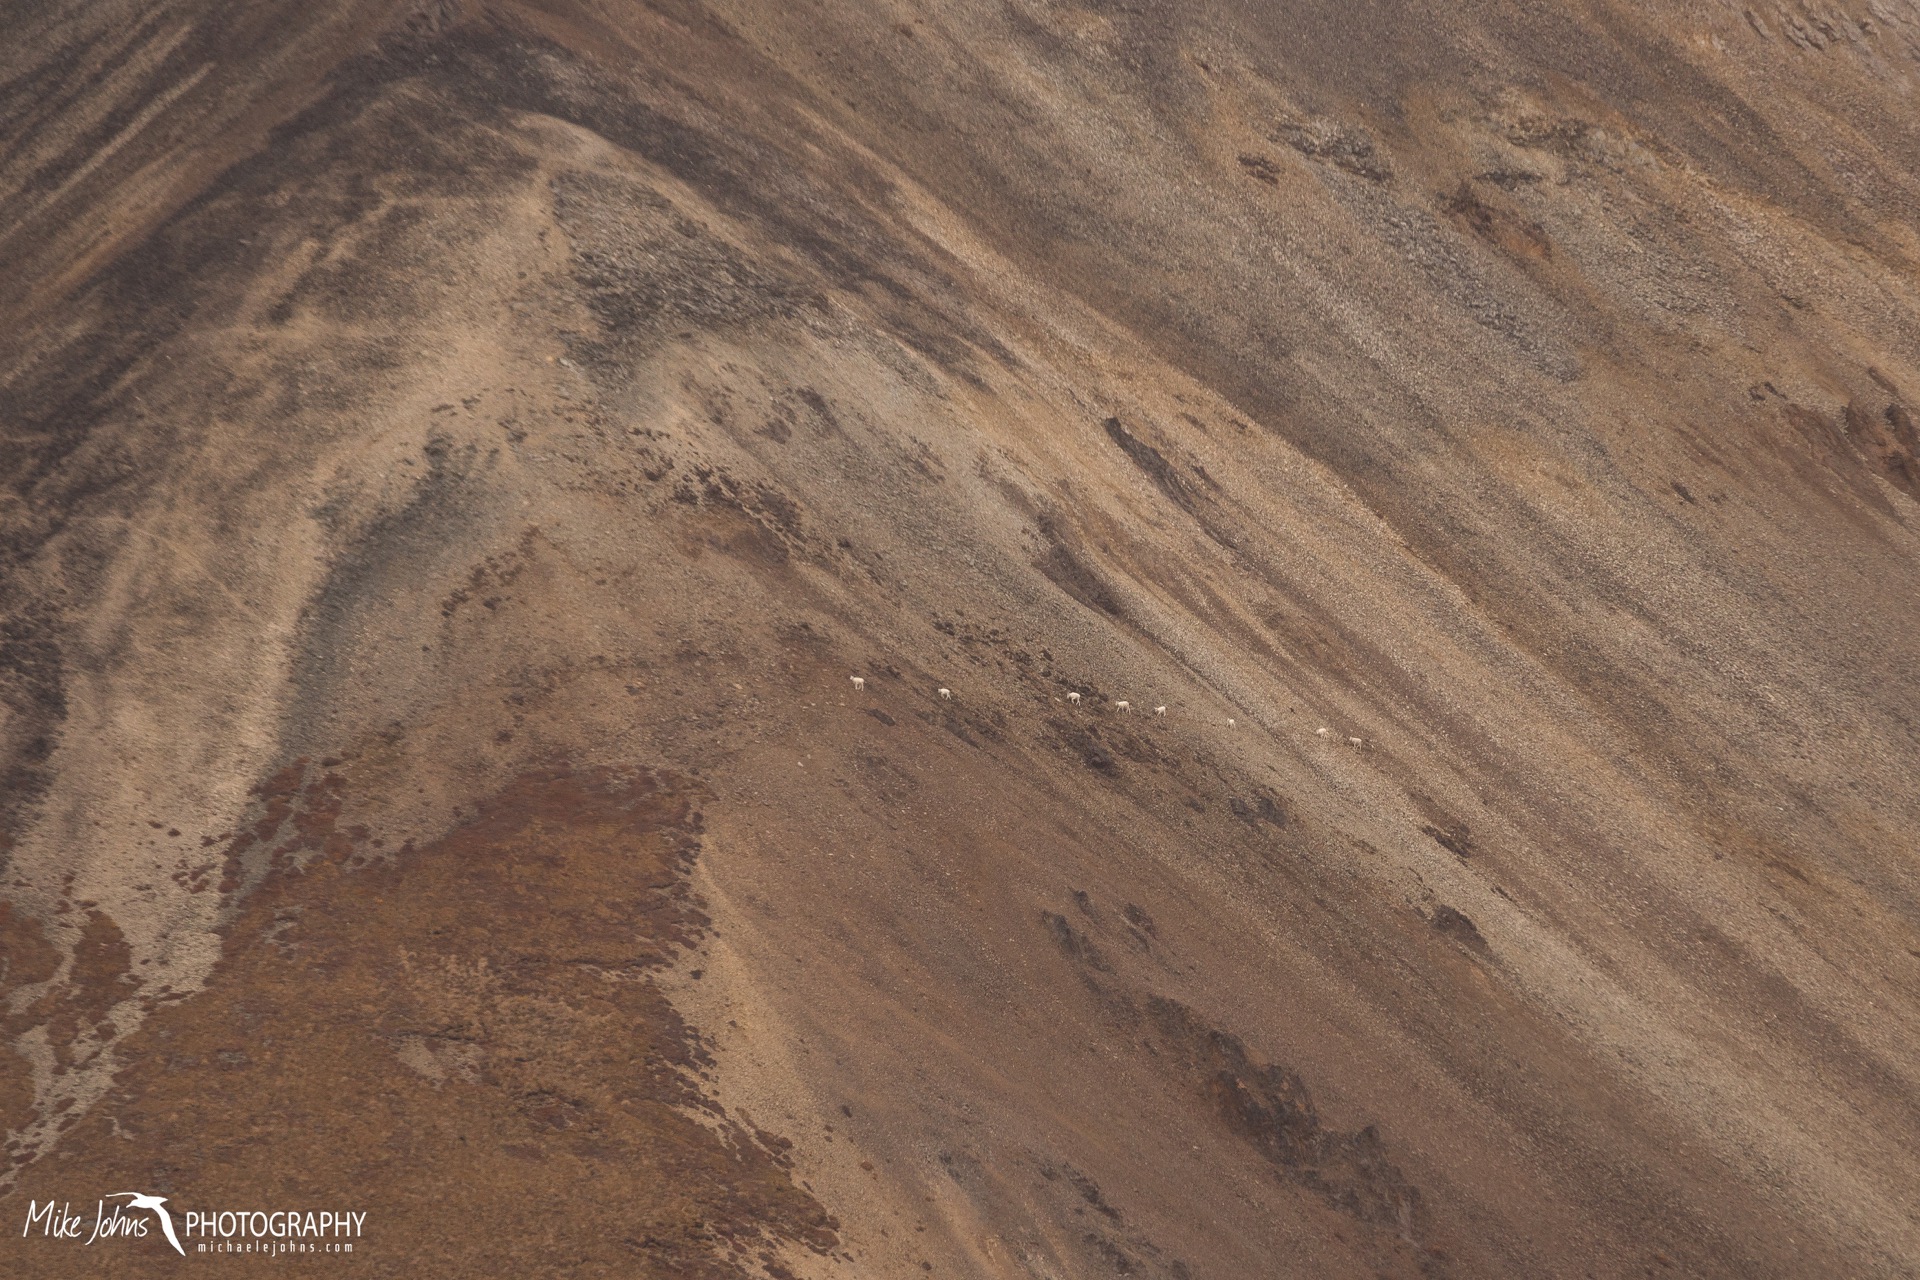
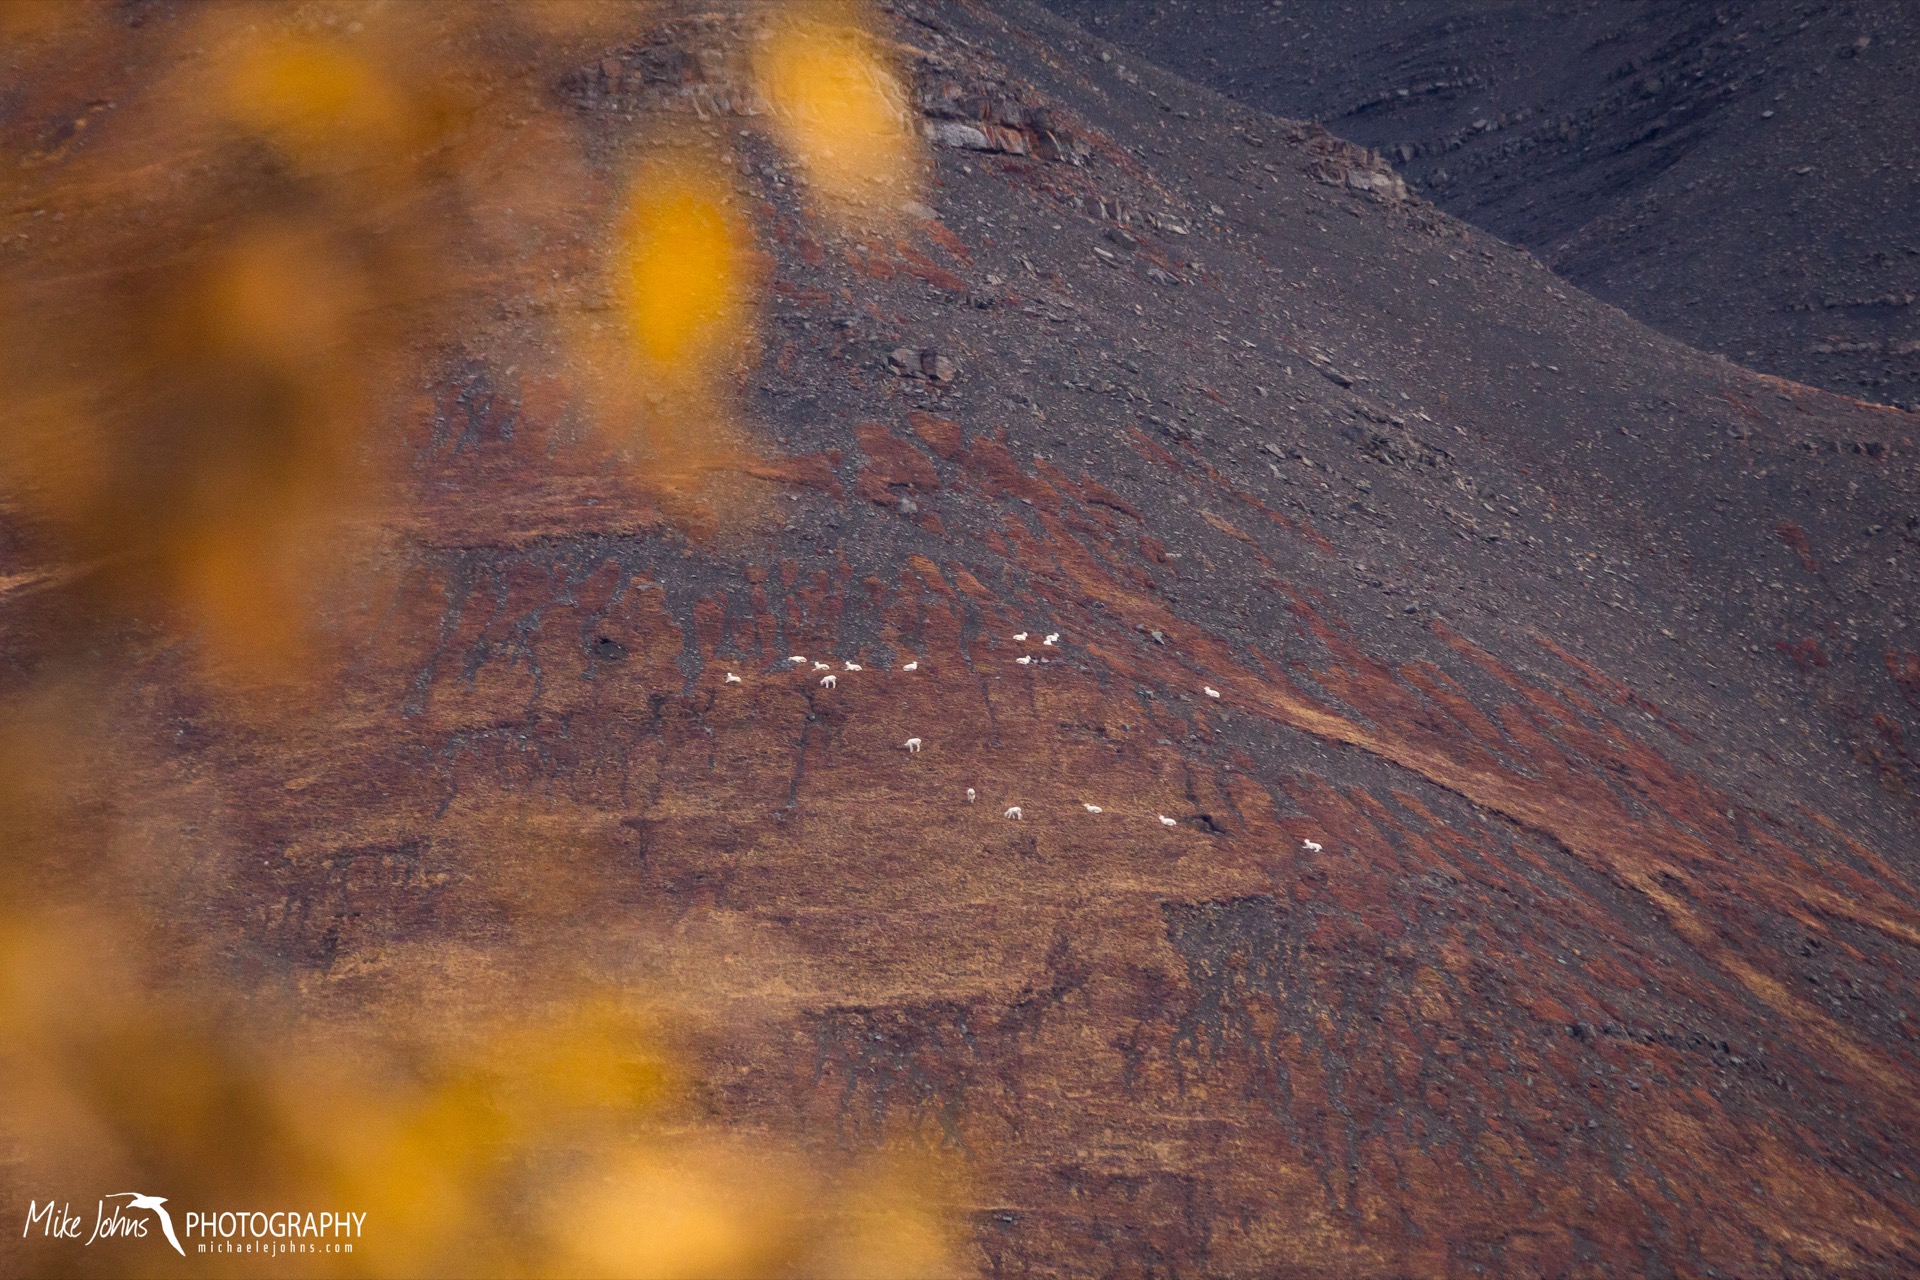
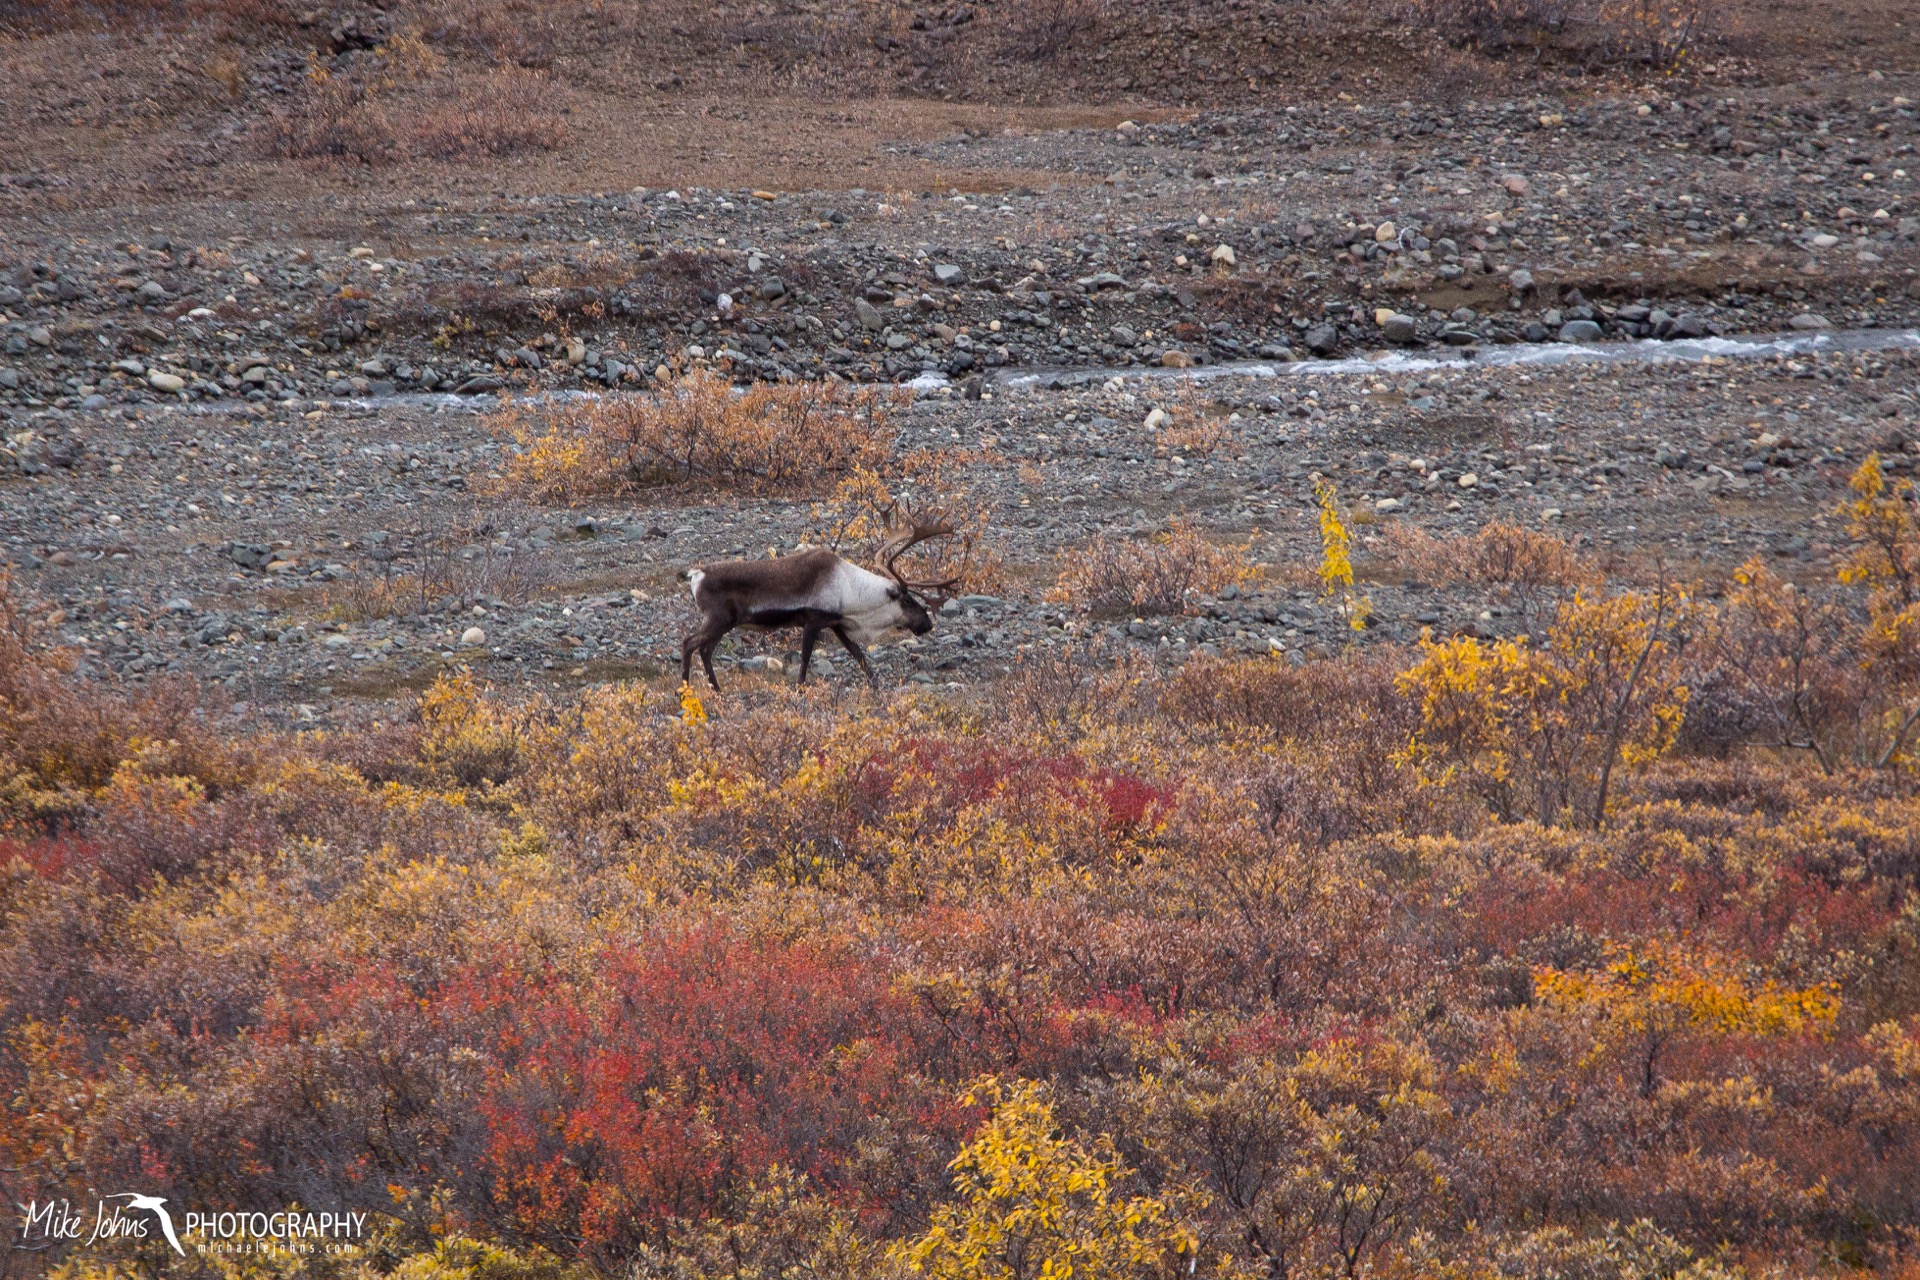
One of the big draws to visiting Denali National Park is the chance to get close looks at wildlife that is otherwise more elusive outside the park’s boundaries. Just minutes into the drive, we spotted a large flock of willow ptarmigan waddling along the gravel shoulder. Birds don’t stop up traffic in quite the same way as the large mammals like bears, moose, and caribou do. It was easy to tell when a grizzly had been sighted, where sometimes 20 or more cars would pull over with long expensive lenses sticking out of passenger windows, aiding newcomers by pointing out which direction to look for the bear. The following is our sightings list for the day:

Birds
Horned Grebe - 2
Greater Scaup - 12
American Widgeon - 8
Spruce Grouse - 1
Willow Ptarmigan - 27
Grey Jay - 5
Black-billed Magpie - 10

Mammals
Brown Bear - 3
Moose - 3
Caribou - 8
Dall Sheep - 49
Red Fox - 1
Porcupine - 1
Arctic Ground Squirrel - 1

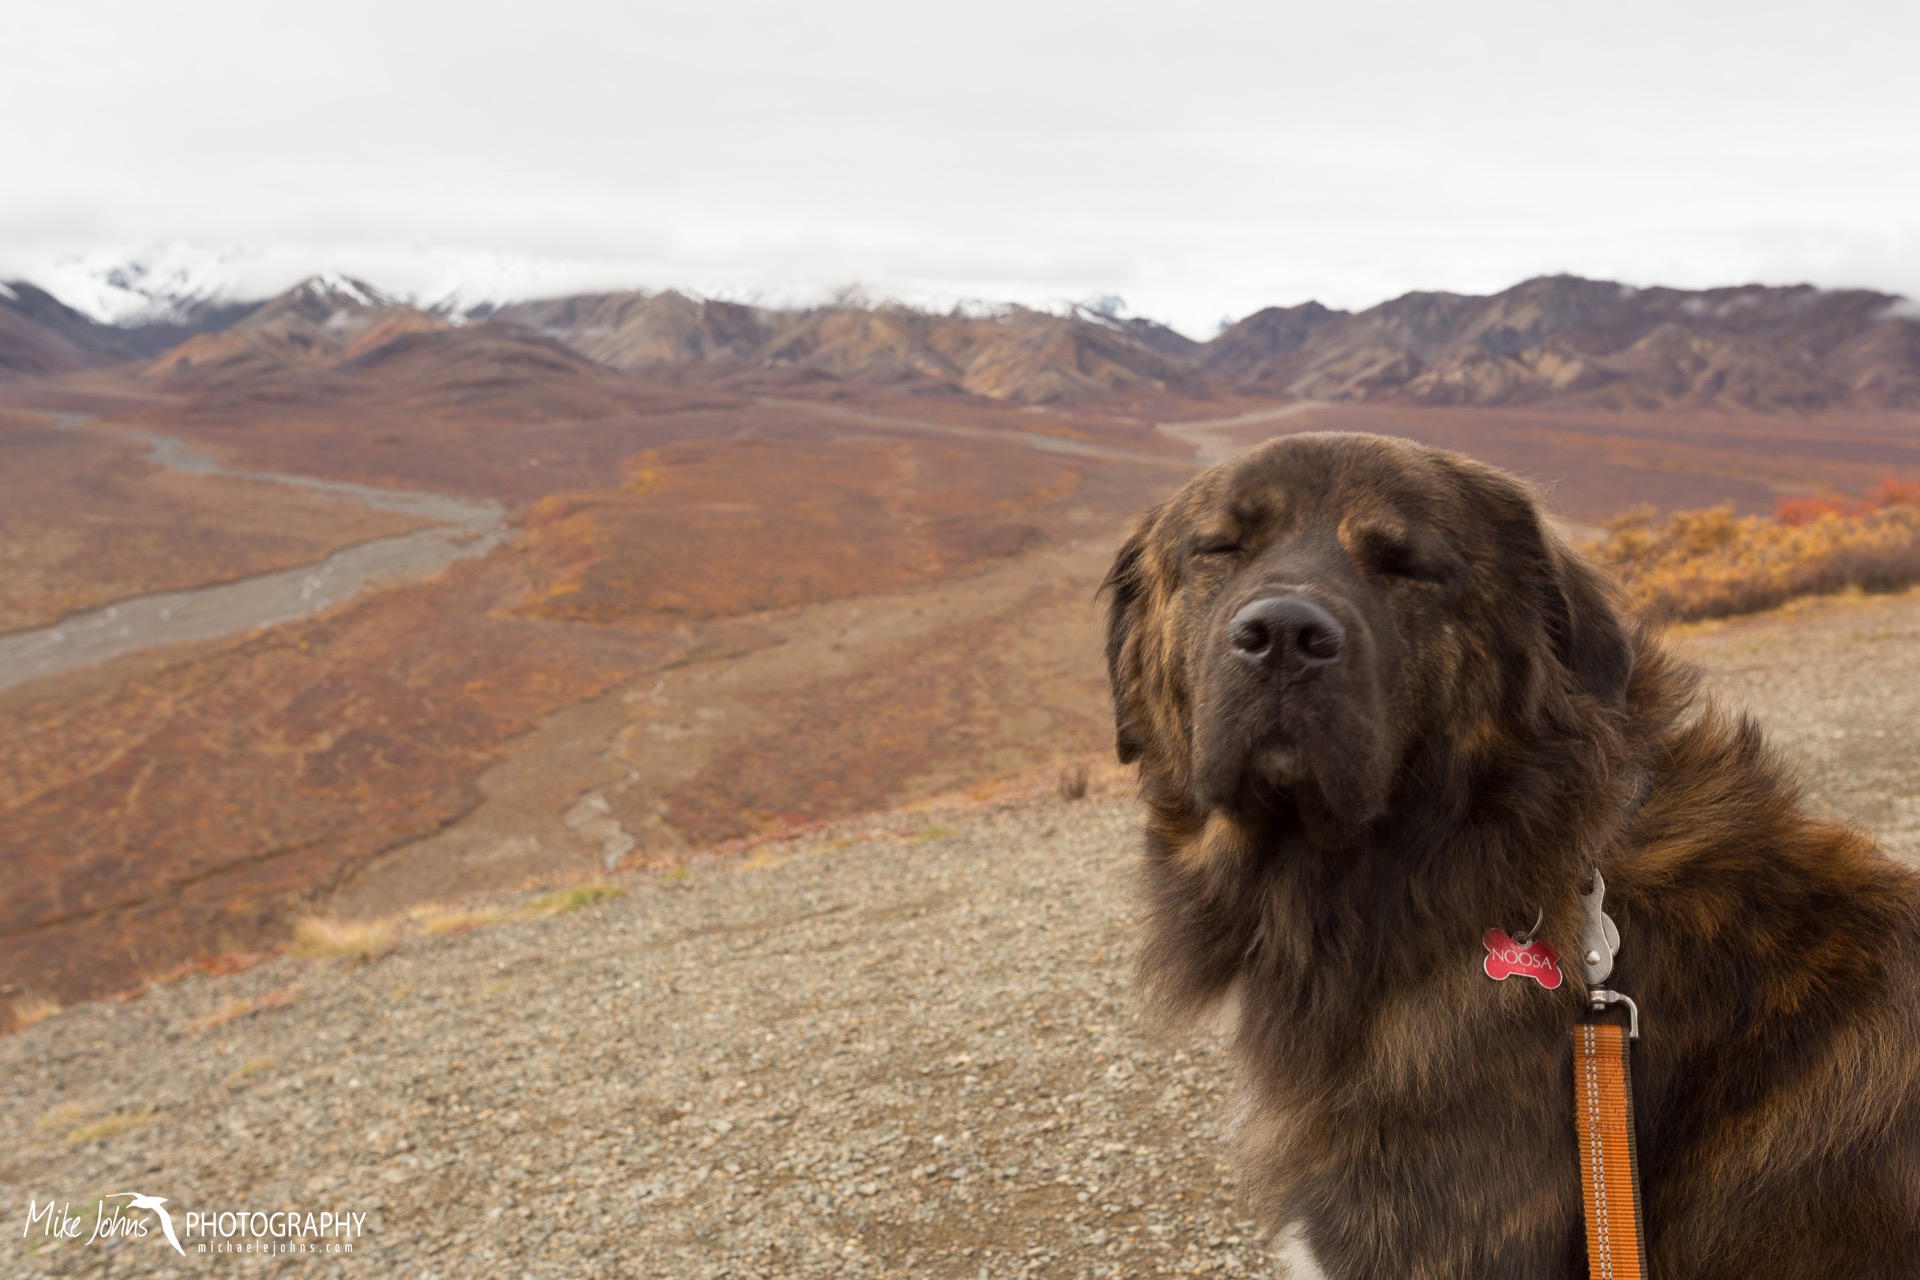
We were lucky to win the road lottery, but not so lucky with the weather. A very wet and rainy fall this year in interior Alaska meant that most of the towering mountains, including the biggest of them all, were obscured from view. Still, what we could see at ground level was more than enough to make the trip worth while. Perhaps next year we will win another day in the park and try our luck again.

Visualizing Long-term Data by Michael Johns

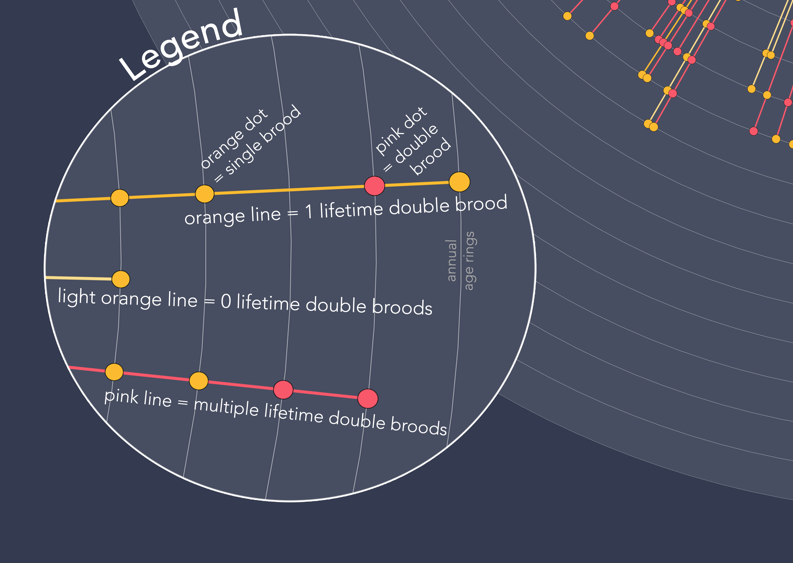
Point Blue Conservation Science has amassed an impressive long-term dataset on the breeding histories of known-age Cassin's auklets on Southeast Farallon Island. These data are visualized in the figure above. The dedication to maintaining and checking 400+ artificial nest boxes every 5-days for the past 34 years has allowed researchers to reveal some unique patterns in the life history of this small seabird. For example, Cassin's auklets are the only member of the taxonomic Alcid family to attempt two complete broods in a single breeding season, known as double brooding. In a recent study published in the journal Proceedings of the Royal Society B, my colleagues and I used these data to examine how double brooding impacts future reproductive potential and survival for birds that attempt such a behavior multiple times over the course of their lives. It turns out that so called "repeat double brooders" represent a subset of high quality individuals that can offset the short-term costs of increased reproductive effort, living well into old age and producing more offspring than birds that never double brood. Visit the publisher’s website by clicking HERE

Orange is the New Fairbanks by Michael Johns

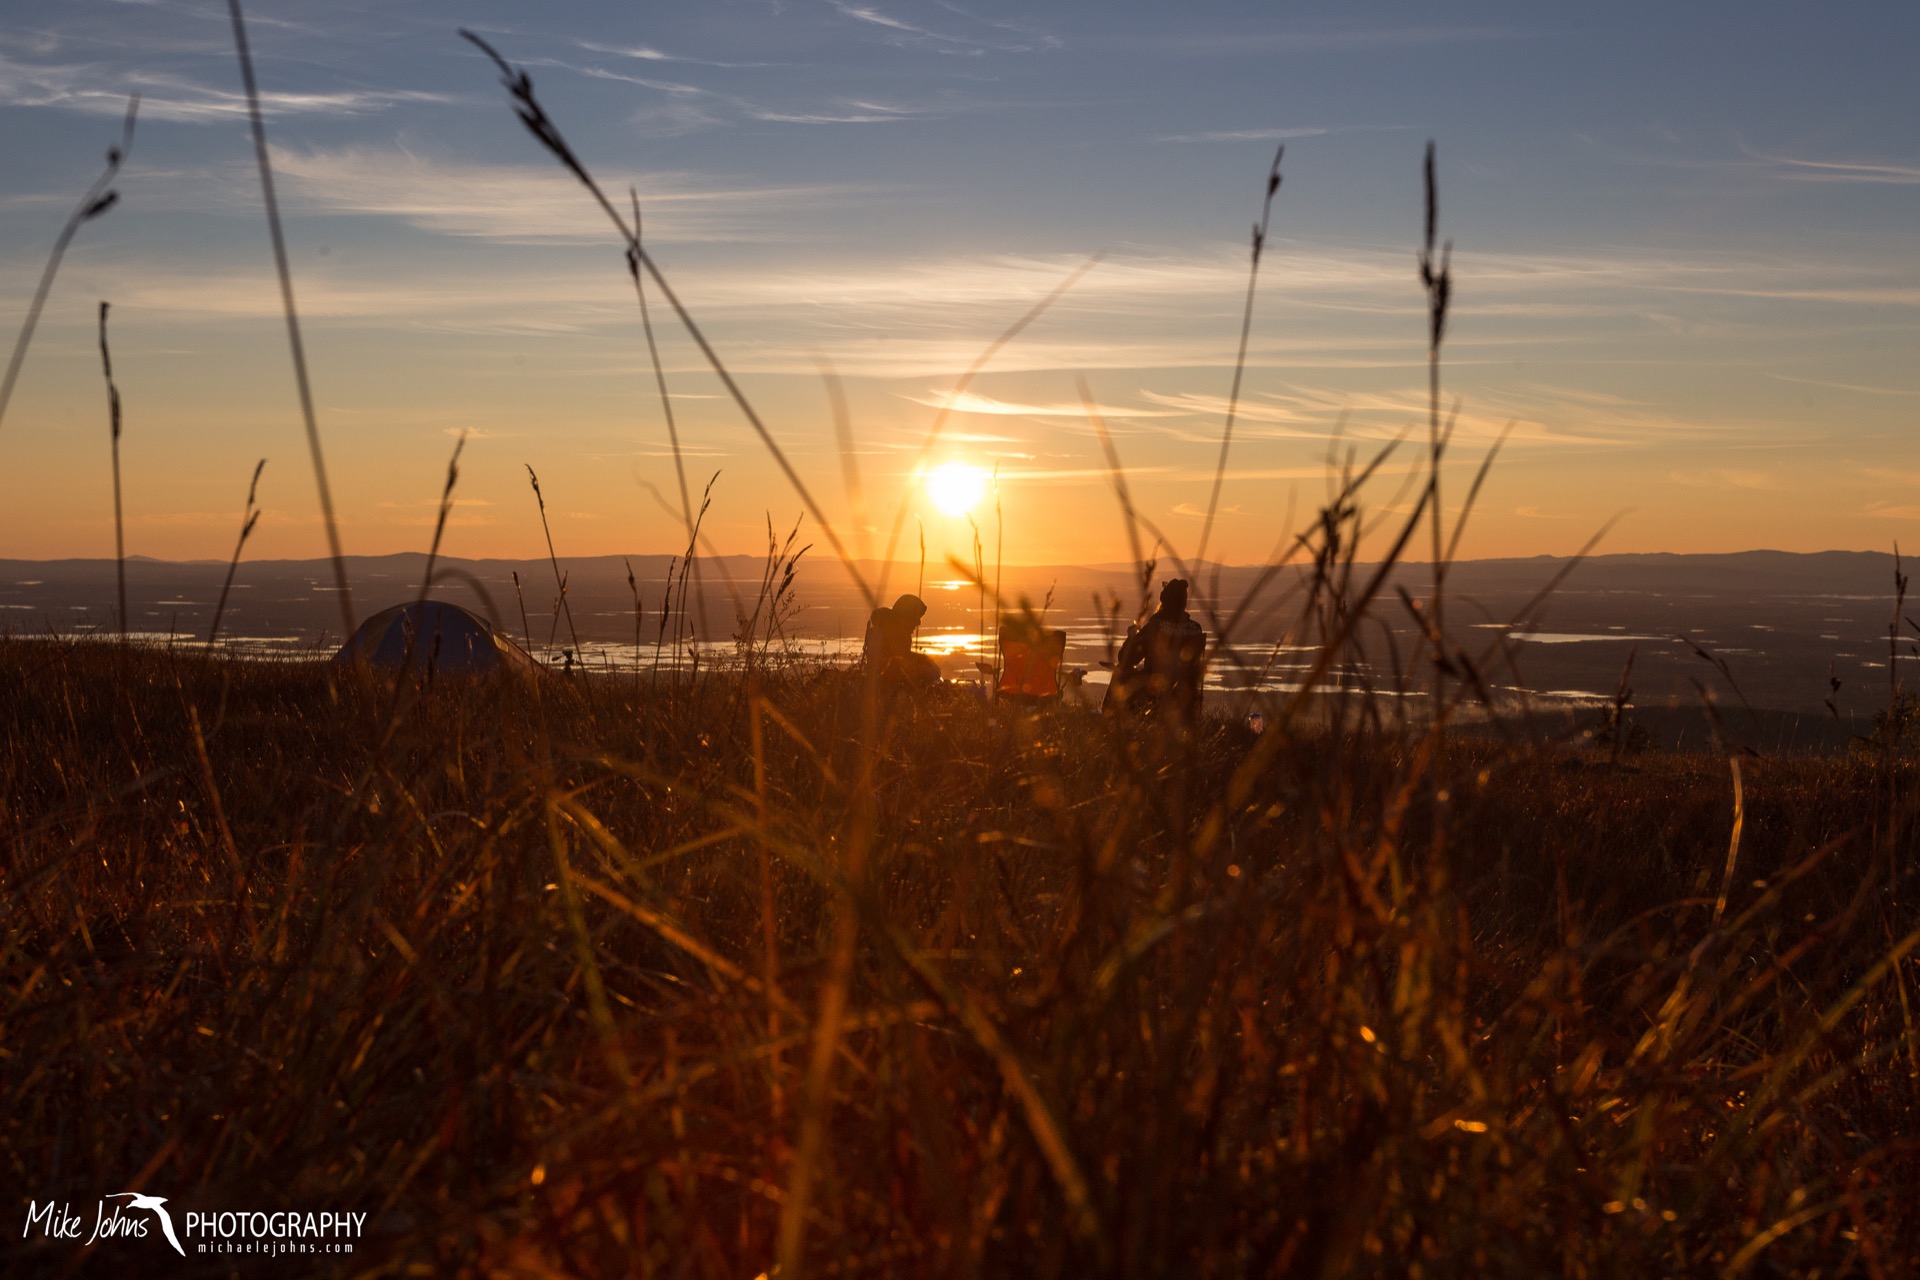
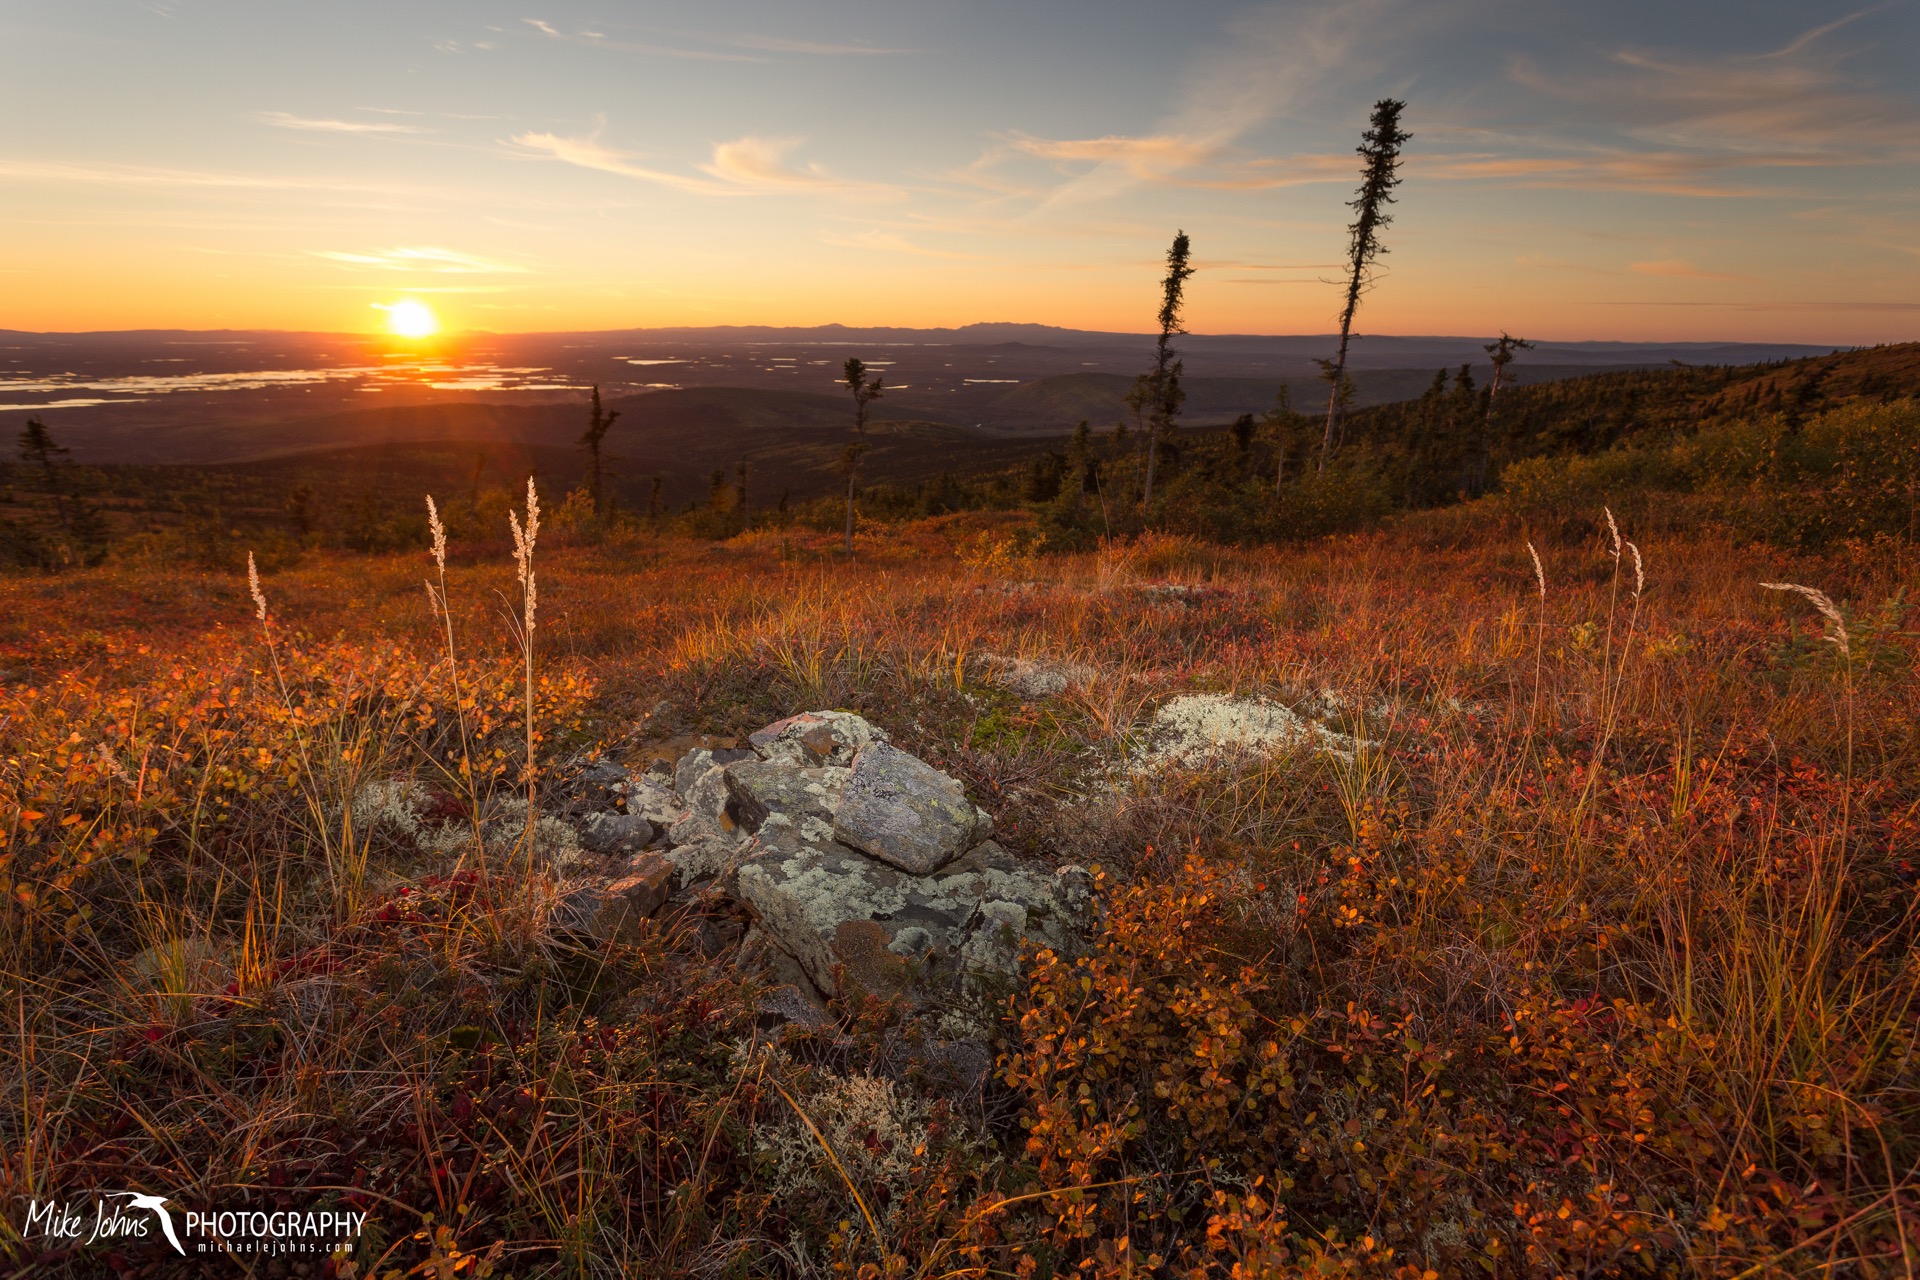
For a brief moment in time, vegetative colors in the far north shift from the middle of the visible spectrum (green, where photosynthesis occurs), to the " far right" shades of amber and red. September in interior Alaska offers a narrow window for fall foliage, with reduced day-lengths and colder nightly temperatures signaling to the trees and shrubs a change in the season. The tundra is particularly breathtaking this time of year, as the grasses become fiery orange and the ground cover of blue and bear berries develops a rich red hue. Contrasting this warm color palette are patches of mint green lichen, wind swept grey granite, and the occasional stunted dark green spruce. The golden hour of sunset, still prolonged given the sun's path at such a high latitude, only serves to enhance the overwhelming golden look of the landscape. 

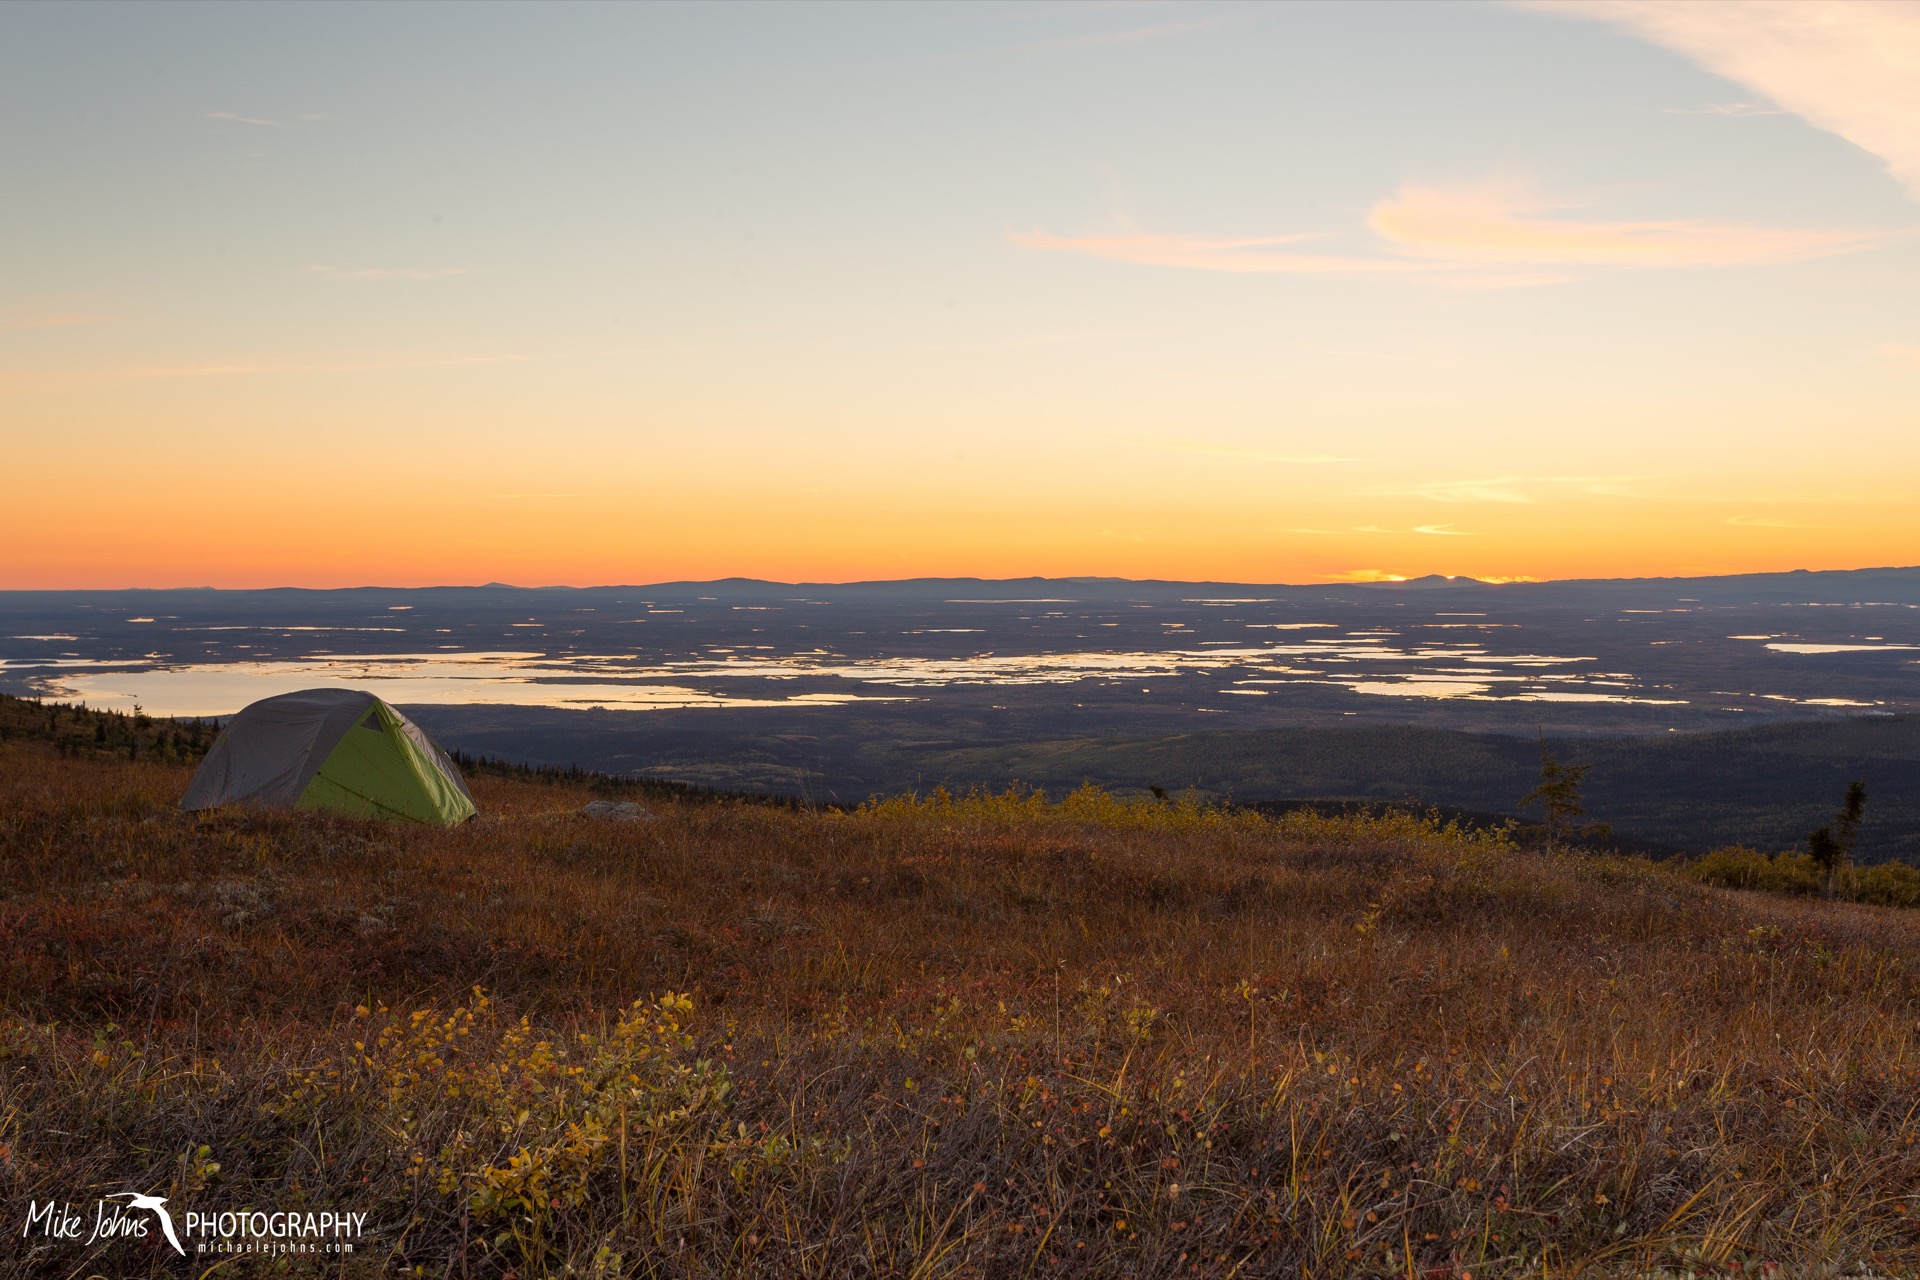
To take advantage of this narrow window of fall colors, we packed up the truck for a quick overnight camping trip with our friend Kyle, at his "secret" berry picking spot just over an hour's drive outside of town. Clear skies offered sweeping views of Minto Flats, a 500,000 acre wetland and state game refuge. As darkness fell, a complete absence of the moon allowed the Milky Way an it's billions of other worlds to shine. Later in the night, material flowing from our own star triggered a decent display of northern lights over our tents, with subtle pinks and purples not visible to the naked eye revealed with a long-exposure of the camera. Waking up to a frosty morning tundra and sundogs were a sobering reminder that winter is just around the corner. 

Winter Movements by Michael Johns

After several years of geolocator tagging work (see image below), we finally have enough information to begin to paint a better picture of the non-breeding winter distribution of Cassin's auklets from Southeast Farallon Island. At the start of any research project, the most important first step in the analysis process is to visualize the data. The idea behind this visualization was to depict three key environmental characteristics of the auklet's winter habitat in a single plot; sea surface temperature (SST), depth, and distance from island. SST will be used as a proxy for productivity, as colder water in this region is generally associated with nutrient rich upwelling processes, depth to characterize the preferred ocean zone (shallow shelf, steep slope, or deep abyssal plain), and distance from island to explore the possible limits of their dispersal. 

Glancing at this plot, you can see by October birds are fairly spread out between 45°N (dark purple colors - Northern California area) and roughly 33°N (orange colors - Southern California). They are also exposed to quite a range of SST, from 14°C up to nearly 22°C. By late January, all of the birds are relatively close to the island (small bubble size) and experiencing roughly the same SST, before spreading out again in late February, with most birds staying at around 35°N. The 2015-16 season was a particularly warm year for SST, which my explain why only birds in the northern reaches were finding water colder than 14°C. The next step in this exploratory process is to look at auklet movements during the 2016-17 and 2017-18 seasons, which were moderate to average years for SST in the eastern north Pacific. Ultimately, these and possibly additional environmental covariates will be used to model the winter habitat use of Cassin's auklets off the California Coast. 

Note the geolocator tag on the left leg of this Cassin's auklet. Geolocators are devices which record ambient light levels that are later used to estimate latitude and longitude. 

Tagging data courtesy of a partnership between Point Blue Conservation Science and the USFWS. Remotely sensed environmental data were downloaded from the NOAA repository https://coastwatch.pfeg.noaa.gov/erddap. This plot was created in R with the ggplot2 package.